. 2012 Apr 17;109(16):6175-80.
doi: 10.1073/pnas.1203941109. Epub 2012 Apr 2.

Viral-induced encephalitis initiates distinct and functional CD103+ CD11b+ brain dendritic cell populations within the olfactory bulb

Affiliations

Viral-induced encephalitis initiates distinct and functional CD103+ CD11b+ brain dendritic cell populations within the olfactory bulb

Paul M D'Agostino et al. Proc Natl Acad Sci U S A. .

Abstract

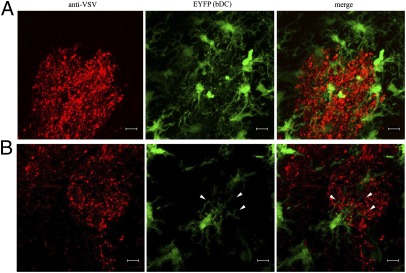
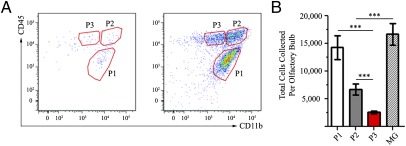
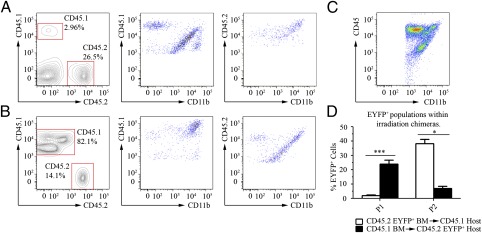
Dendritic cells (DC) are antigen-presenting cells found in both lymphoid and nonlymphoid organs, including the brain (bDC) of Cd11c/eyfp transgenic C57BL/6 mice. Using an intranasal vesicular stomatitis virus infection, we demonstrated that EYFP(+) cells amass in areas associated with viral antigens, take on an activated morphology, and project their processes into infected neuronal tissue within the olfactory bulb. These bDC separated into three EYFP(+) CD45(+) CD11b(+) populations, all but one being able to functionally promote both T lymphocyte proliferation and T(H)1 cytokine production. One population was shown to emanate from the brain and a second population was peripherally derived. The third population was of indeterminate origin, being both radiosensitive and not replenished by donor bone marrow. Finally, each EYFP(+) population contained CD11b(+) CD103(+) subpopulations and could be distinguished in terms of CD115, Gr-1, and Ly-6C expression, highlighting mucosal and monocyte-derived DC lineages.


Conflict of interest statement

The authors declare no conflict of interest.

Figures

Fig. 1.
Fig. 1.
bDC surround and probe VSV-infected glomeruli. Representative confocal z-stack analysis of an OB 72 hpi after intranasal VSV infection. (A) A glomerulus labeled with anti-VSV antiserum (red) showed clustering bDC (green). (B) Confocal section visualizing a bDC extending cellular projections (arrowheads) into VSV infected glomerular neuropil. Representative images from three experiments with an n = 3. (Scale bars, 10 μm.)
Fig. 2.
Fig. 2.
EYFP+ bDC within the VSV-infected OB exhibit three phenotypically distinct populations at 96 hpi. (A) Three distinct EYFP+, CD45+, and CD11b+ populations. (B) Analysis of the differences in each CD45+ and CD11b+ population shows that the P1 population represents the majority of EYFP+ cells; the P2 and P3 populations were less abundant. The EYFP+ cell numbers found within the P1 population are nearly double those in the P2 and P3 populations combined. Data representative of three separate experiments with n = 3; error bars represent SEM. ***P < 0.001
Fig. 3.
Fig. 3.
Recombinant VSV-OVA induced bDC process and present antigen to OVA-specific T lymphocytes. (A) Representative confocal images of anti-OVA (red) and EYFP (green) from OB sections from mice intranasally infected with rVSV-OVA at 96 hpi, resulting in OVA and VSV antigen (blue) colocalization within glomeruli. (Scale bars, 50 μm.) (B) rVSV-OVA infection elicited EYFP+ populations analogous to wild-type VSV. (C) P2 and P3 processed in vivo antigens during a rVSV-OVA intranasal infection and drove ex vivo proliferation of OVA-restricted CD8α+, but not CD4+ T cells. Bar graphs represent the average number of proliferating T cells, as determined by a shift in 5-(and 6)-carboxyfluorescein diacetate succinimidyl ester intensity. (D) All three bDC populations facilitated OVA-restricted CD8α+ T-cell proliferation after ex vivo supplementation with OT-I peptide; however P1 was ineffective at presenting OVA. Representative histograms from OT-I peptide treated DC populations plated 1:30 with T cells. (E) P2 and P3 bDC effectively presented OVA antigens to promote OVA-restricted CD4+ T-cell proliferation, but P1 was ineffective. Histograms from OT-II peptide-treated DC populations plated 1:30, and OVA treated plated 1:5. Error bars represent SEM; 6–12 replicates per treatment group. *P valuevs. T Cell Only < 0.05, **P valuevs. T Cell Only < 0.01, ***P valuevs. T Cell Only < 0.001.
Fig. 4.
Fig. 4.
The P1 population is associated with the brain parenchyma, but P2 EYFP+ cells are part of the infiltrating peripheral response. (A) Lethally irradiated Cd45.1 mice, successfully rescued with Cd11c/eyfp (CD45.2) Tg bone marrow and their (B) reciprocal chimeras were intranasally infected with VSV at the LD50. At 96 hpi, blood and OB were analyzed by flow cytometry using antibodies able to discriminate between CD45.1 and CD45.2 variants. In both scenarios a CD45int CD11bhi population (containing P1) was identified as brain resident and radio-resistant, and a CD45hi CD11bhi population (containing P2) was consistently derived from donor progenitor cells from the periphery. The P3 (CD45hi CD11bint) population was conspicuously absent from each chimera set, however, as control (C) CD11c/eyfp mice infected with the same batch of VSV possessed all three populations. These findings were corroborated by (D) EYFP+ cell populations. Data are representative of three experiments with n = 5–6 per experiment; error bars represent SEM. *P valuevs. T Cell Only < 0.05, ***P valuevs. T Cell Only < 0.001.
Fig. 5.
Fig. 5.
bDC populations contain a diverse array of CD103+ CD11b+ and CD103neg CD11b+ cells. (A) Phenotypic analysis of TCRβneg, CD19neg, CD45+, and CD11b+ cells represented by the three EYFP+ populations using a variety of markers characteristic of DC and other immunological subsets. MG (CD45int, CD11b+ and EYFPneg) and common DC (Linneg EYFPhi) from the spleen of infected mice were used as a control. bDC populations were further discriminated by (B) CD103+ and (C) CD103neg subpopulations possessing MHC II, Gr-1, and Ly-6c+ cells. P1 is composed of a more-or-less equal number of CD103+ and CD103neg cells, but all are MHC II, Gr-1, and Ly-6c–negative. P2 contains several populations of cells with phenotypes analogous to mucosal DCs. Finally, P3 is predominantly composed of CD103neg cells with phenotypes similar to monocytes-derived DC. These histograms and dot plots are representative of three separate experiments, with two mice OB pooled per antibody per experiment.

References

    1. Steinman RM, Idoyaga J. Features of the dendritic cell lineage. Immunol Rev. 2010;234:5–17. - PubMed
    1. Steinman RM, et al. Dendritic cell function in vivo during the steady state: A role in peripheral tolerance. Ann N Y Acad Sci. 2003;987:15–25. - PubMed
    1. Steinman RM, Hawiger D, Nussenzweig MC. Tolerogenic dendritic cells. Annu Rev Immunol. 2003;21:685–711. - PubMed
    1. Steinman RM, Cohn ZA. Identification of a novel cell type in peripheral lymphoid organs of mice. I. Morphology, quantitation, tissue distribution. J Exp Med. 1973;137:1142–1162. - PMC - PubMed
    1. Steinman RM, Witmer MD. Lymphoid dendritic cells are potent stimulators of the primary mixed leukocyte reaction in mice. Proc Natl Acad Sci USA. 1978;75:5132–5136. - PMC - PubMed

Publication types

MeSH terms

LinkOut - more resources