

Structural diversity in social contagion
- PMID: 22474360
- PMCID: PMC3341012
- DOI: 10.1073/pnas.1116502109
Structural diversity in social contagion
Abstract
The concept of contagion has steadily expanded from its original grounding in epidemic disease to describe a vast array of processes that spread across networks, notably social phenomena such as fads, political opinions, the adoption of new technologies, and financial decisions. Traditional models of social contagion have been based on physical analogies with biological contagion, in which the probability that an individual is affected by the contagion grows monotonically with the size of his or her "contact neighborhood"--the number of affected individuals with whom he or she is in contact. Whereas this contact neighborhood hypothesis has formed the underpinning of essentially all current models, it has been challenging to evaluate it due to the difficulty in obtaining detailed data on individual network neighborhoods during the course of a large-scale contagion process. Here we study this question by analyzing the growth of Facebook, a rare example of a social process with genuinely global adoption. We find that the probability of contagion is tightly controlled by the number of connected components in an individual's contact neighborhood, rather than by the actual size of the neighborhood. Surprisingly, once this "structural diversity" is controlled for, the size of the contact neighborhood is in fact generally a negative predictor of contagion. More broadly, our analysis shows how data at the size and resolution of the Facebook network make possible the identification of subtle structural signals that go undetected at smaller scales yet hold pivotal predictive roles for the outcomes of social processes.
Conflict of interest statement
The authors declare no conflict of interest.
Figures
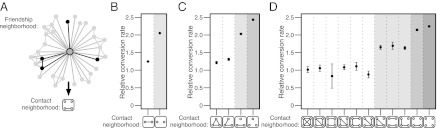
 confidence intervals and implicitly reveal the relative frequency of the different topologies.
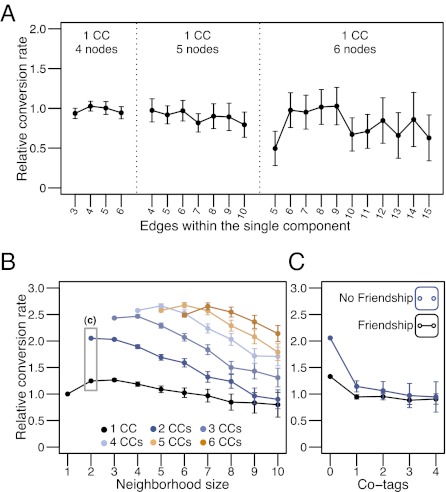
 confidence intervals.
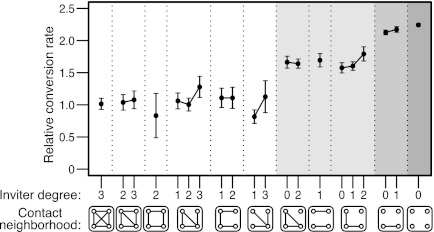
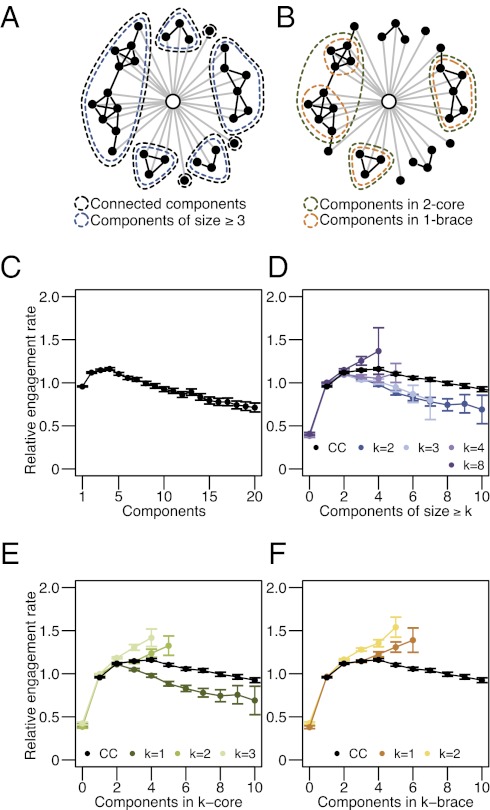
 . (B) Illustration of the k-core and the k-brace, delineating the connected components of the 2-core and the 1-brace. (C) Engagement as a function of connected component count. (D) Engagement as a function of the number of components of size
  , for
, for  , with connected component (CC) count shown for comparison. (E) Engagement as a function of k-core component count for
  , with CC count shown for comparison. (F) Engagement as a function of k-brace component count for
  , with CC count shown for comparison. Engagement rates are reported on a relative scale, where 1.0 signifies the average conversion rate of all 50-node neighborhoods. All error bars are 95% confidence intervals. For other neighborhood sizes, see
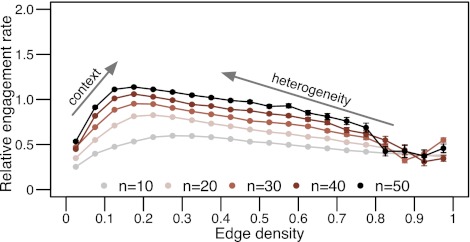
 , we see that when component count is not accounted for, an internal engagement optimum is observed, showing the combined forces of focused context and structural heterogeneity. Engagement rates are reported on a relative scale, where 1.0 signifies the average conversion rate of all 50-node neighborhoods. All error bars are 95% confidence intervals.
References
-
- Pastor-Satorras R, Vespignani A. Epidemic spreading in scale-free networks. Phys Rev Lett. 2001;86:3200–3203. - PubMed
-
- Dodds PS, Watts DJ. Universal behavior in a generalized model of contagion. Phys Rev Lett. 2004;92:218701. - PubMed
-
- Backstrom L, Huttenlocher D, Kleinberg J, Lan X. Group formation in large social networks: Membership, growth, and evolution. In: Eliassi-Rad T, Ungar LH, Craven M, Gunopulos D, editors. Proceedings of the 12th ACM SIGKDD International Conference on Knowledge Discovery and Data Mining. New York: Association for Computing Machinery; 2006. pp. 44–54.
-
- Kearns M, Suri S, Montfort N. An experimental study of the coloring problem on human subject networks. Science. 2006;313:824–827. - PubMed
Publication types
MeSH terms
LinkOut - more resources
Full Text Sources
Other Literature Sources
