. 2012 Apr 17;109(16):6217-22.
doi: 10.1073/pnas.1119540109. Epub 2012 Apr 2.

RNA signatures allow rapid identification of pathogens and antibiotic susceptibilities

Affiliations

RNA signatures allow rapid identification of pathogens and antibiotic susceptibilities

Amy K Barczak et al. Proc Natl Acad Sci U S A. .

Abstract

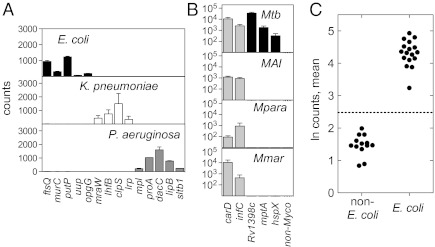
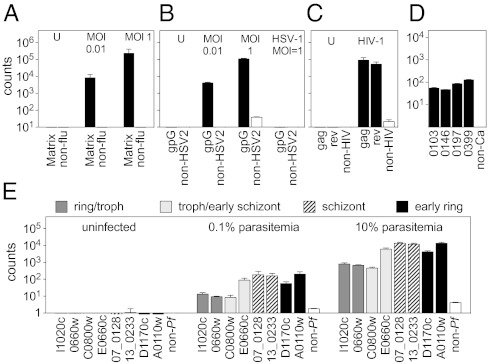
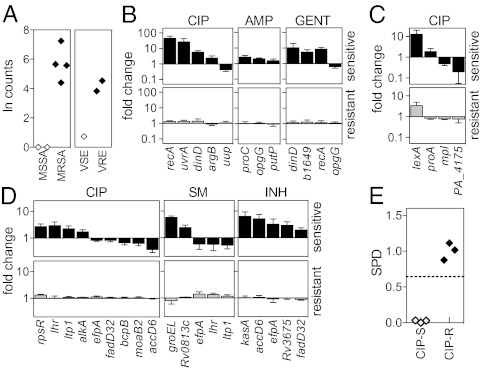
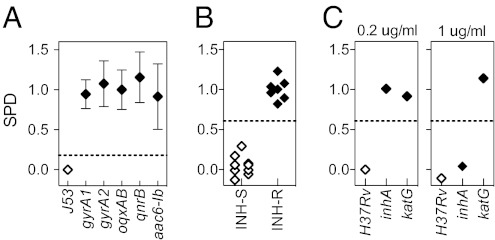
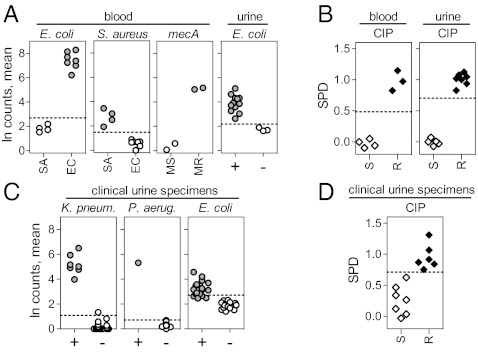
With rising rates of drug-resistant infections, there is a need for diagnostic methods that rapidly can detect the presence of pathogens and reveal their susceptibility to antibiotics. Here we propose an approach to diagnosing the presence and drug-susceptibility of infectious diseases based on direct detection of RNA from clinical samples. We demonstrate that species-specific RNA signatures can be used to identify a broad spectrum of infectious agents, including bacteria, viruses, yeast, and parasites. Moreover, we show that the behavior of a small set of bacterial transcripts after a brief antibiotic pulse can rapidly differentiate drug-susceptible and -resistant organisms and that these measurements can be made directly from clinical materials. Thus, transcriptional signatures could form the basis of a uniform diagnostic platform applicable across a broad range of infectious agents.


Conflict of interest statement

The authors declare no conflict of interest.

Figures

Fig. 1.
Fig. 1.
Identification of bacteria in culture with direct RNA detection. (A and B) Bacterial cultures were lysed and analyzed with nCounter probes for species-specific transcripts. y axis: transcript raw counts; x axis: gene. Each bar represents the average and SD of two biological replicates. (A) Detection from culture of Gram-negative bacteria. Probes are shown for E. coli (black bars), K. pneumoniae (white bars), and P. aeruginosa (gray bars). (B) Genus- and species-specific detection of mycobacteria in culture: M. tuberculosis (Mtb), M. avium subsp. intracellulare (MAI), M. paratuberculosis (Mpara), and M. marinum (Mmar). Gray bars show genus-wide probes; black bars show M. tuberculosis-specific probes. (C) Synthesis of four E. coli probes into a single organism ID score. The natural logs of the observed counts for each transcript were averaged. Each point represents a single strain. The dashed line indicates three SDs from the mean of the non-E. coli samples (P = 0.0027).
Fig. 2.
Fig. 2.
RNA-based identification of viruses, a fungus, and a parasite by direct analysis of lysates using nCounter probes. Shaded bars indicate organism-specific probes, white bars indicate average of non-organism probes. (A) 293T cells infected with influenza A at the indicated MOIs and harvested after 8 h. U, uninfected; non-flu, average of 42 non-influenza probes. Error bars in A indicate the SD of two biological replicates. (B) HeLa cells infected with HSV-1 or HSV-2 at the indicated MOIs and harvested after 24 h. U, uninfected; non-HSV2, average of 44 non-HSV-2 probes. (C) Human peripheral blood mononuclear cells infected with HIV-1 and harvested after 36 h. U, uninfected; non-HSV2, average of 41 non-HIV probes. (D) Candida albicans grown to log phase lysed. Non-Ca, average of 80 non-Candida albicans probes. Error bars in BD indicate SD of two technical replicates from one of two representative independent experiments. (E) Primary red blood cells infected with P. falciparum and harvested at the indicated levels of parasitemia. Non-Pf, average of 32 non-Plasmodium falciparum probes. Error bars in E indicate the SD of two biological replicates.
Fig. 3.
Fig. 3.
RNA signature-based determination of antimicrobial susceptibility. (A) Detection of resistance genes on mobile genetic elements. For MSSA and MRSA: detection of mecA transcript upon cloxacillin exposure. For vancomycin-sensitive Enterococcus (VSE) and VRE: detection of vanA upon vancomycin exposure. Each point represents a different clinical isolate. (BD) Transcriptional responses to drug exposure. Log-phase cultures were exposed to antibiotic, lysed, and analyzed using nCounter probe sets. Counts were normalized to the mean of the middle 50% of all counts for a sample, and induction was determined by comparing drug-exposed and unexposed samples. Genes contributing to the signature are on the x axis. Shown are the responses of a panel of susceptible (black bars, Upper) or resistant (gray bars; Lower) strains of E. coli to ciprofloxacin (CIP), ampicillin (AMP), or gentamicin (GM) (B); of P. aeruginosa to ciprofloxacin (C); and of M. tuberculosis to isoniazid (INH), streptomycin (SM), or ciprofloxacin (D). Error bars represent SD of three to seven isolates tested. See SI Appendix, Table S3 for a full list of strains tested. (E) SPD of E. coli laboratory and clinical isolates exposed to ciprofloxacin. Transcriptional responses of each tested isolate were condensed into a single metric, SPD. The dashed line indicates three SDs from the mean of the resistant samples. Each point represents one strain performed in two to four biological replicates.
Fig. 4.
Fig. 4.
Determination of antibiotic susceptibility is independent of the mechanism of resistance. (A) Ciprofloxacin-sensitive E. coli J53 and derivatives containing either a chromosomal mutation in gyrA or plasmid-mediated quinolone resistance determinants [aac(6′)-Ib, qnrB, or oqxAB] were exposed to ciprofloxacin. Error bars indicate mean and SD of two biological duplicates from one of two independent experiments. (B) M. tuberculosis laboratory and clinical isolates exposed to 1 μg/mL isoniazid. INH-R, isoniazid-resistant; INH-S, isoniazid-sensitive.(C) Isoniazid-sensitive and high- or low-level resistant M. tuberculosis strains were exposed to isoniazid at 1 μg/mL or 0.2 μg/mL. Dashed lines indicate three SDs from the mean of the resistant samples.
Fig. 5.
Fig. 5.
Identification of bacteria and determination of antibiotic susceptibility directly from spiked samples and clinical urine specimens. (A) Detection of species-specific transcripts in blood or urine spiked with S. aureus (SA) or E. coli (EC) and discrimination of MSSA (MS) from MRSA (MR) by direct detection of mecA transcripts in spiked blood. The natural logs of the observed counts for each of four species-specific transcripts were averaged to generate the organism ID score. +, spiked urine; −, healthy control urine. Each point represents a different isolate. (B) Discrimination of ciprofloxacin-sensitive (S) from ciprofloxacin-resistant (R) E. coli in spiked blood or urine using expression signatures (expressed as SPD). (C) Detection of species-specific transcripts in clinical urine specimens. + indicates the presence (>105/mL); – indicates the absence (<105/mL) of the indicated species. Each point represents a different urine specimen. (D) Discrimination of CIPS from CIPR E. coli in validated E. coli-positive (>105/mL) clinical urine specimens using expression signatures (expressed as SPD). Dashed lines in A and C indicate three SDs from mean of control, nonorganism samples. Dashed lines in B and D indicate three SDs from the mean of resistant samples.

References

    1. Park MM, Davis AL, Schluger NW, Cohen H, Rom WN. Outcome of MDR-TB patients, 1983-1993. Prolonged survival with appropriate therapy. Am J Respir Crit Care Med. 1996;153:317–324. - PubMed
    1. Paul M, et al. Systematic review and meta-analysis of the efficacy of appropriate empiric antibiotic therapy for sepsis. Antimicrob Agents Chemother. 2010;54:4851–4863. - PMC - PubMed
    1. Ince J, McNally A. Development of rapid, automated diagnostics for infectious disease: Advances and challenges. Expert Rev Med Devices. 2009;6:641–651. - PubMed
    1. Weile J, Knabbe C. Current applications and future trends of molecular diagnostics in clinical bacteriology. Anal Bioanal Chem. 2009;394:731–742. - PMC - PubMed
    1. Cunningham J, Perkins M. Diagnostics for Tuberculosis: Global Demand and Market Potential. Geneva: WHO; 2006.

Publication types

MeSH terms