. 2012:2012:438238.
doi: 10.1155/2012/438238. Epub 2012 Mar 18.

TXNIP links innate host defense mechanisms to oxidative stress and inflammation in retinal Muller glia under chronic hyperglycemia: implications for diabetic retinopathy

Affiliations

TXNIP links innate host defense mechanisms to oxidative stress and inflammation in retinal Muller glia under chronic hyperglycemia: implications for diabetic retinopathy

Takhellambam S Devi et al. Exp Diabetes Res. 2012.

Abstract

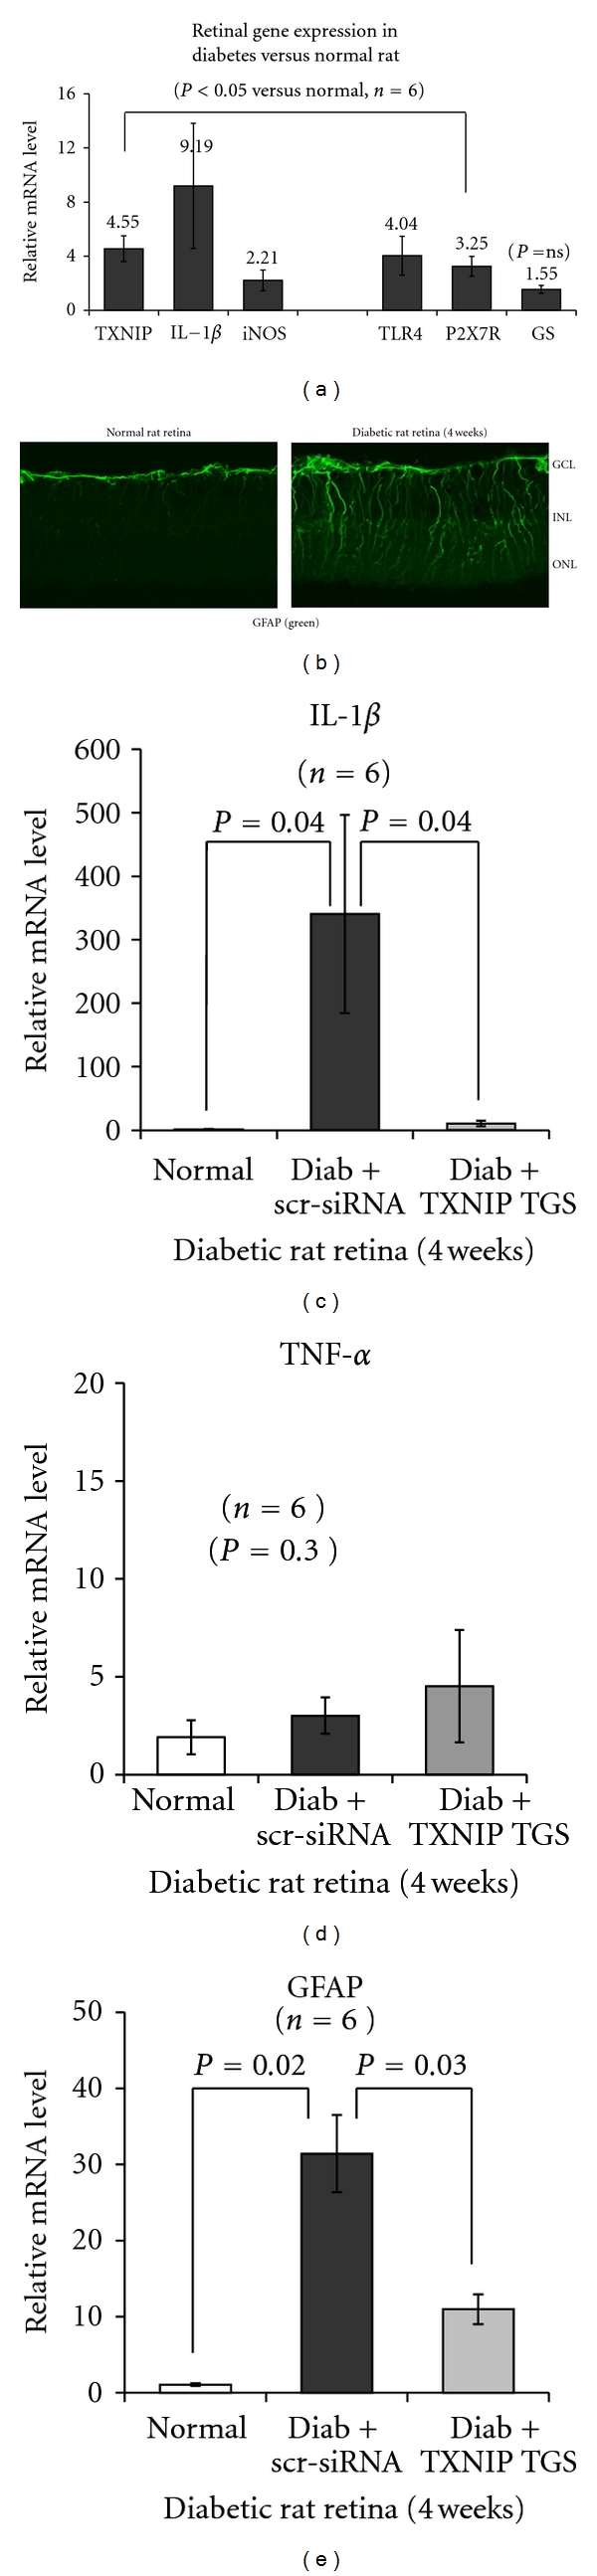
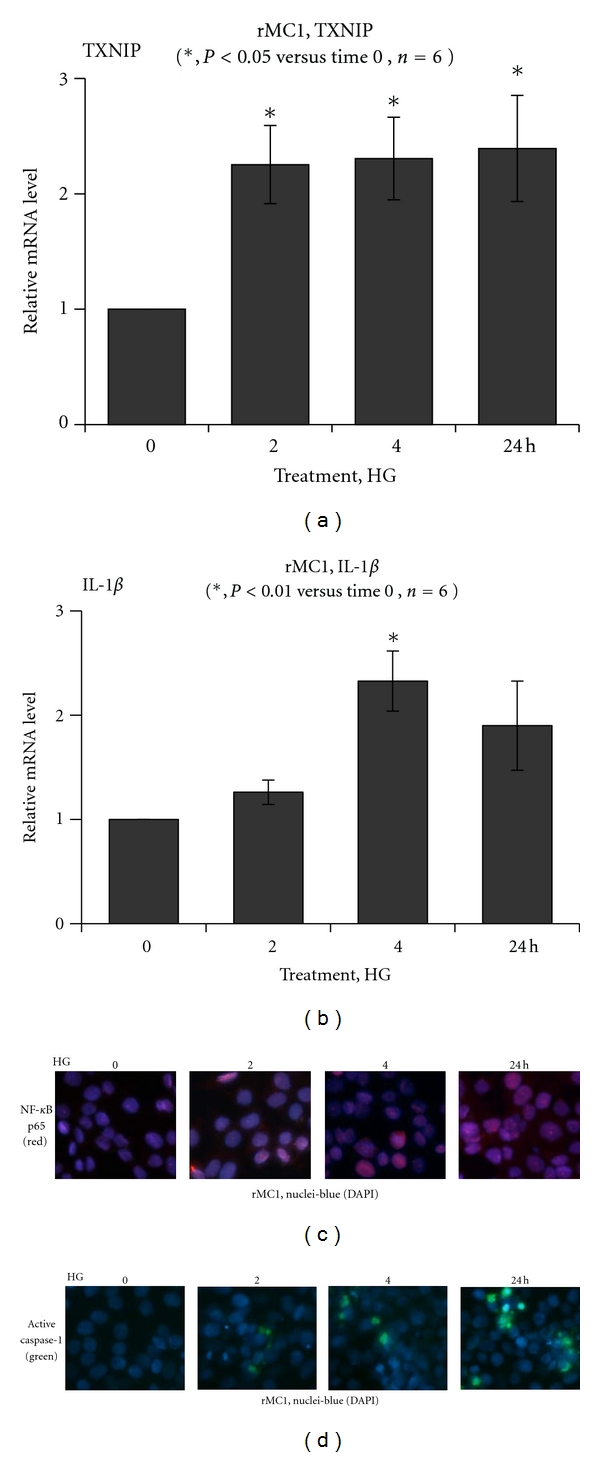
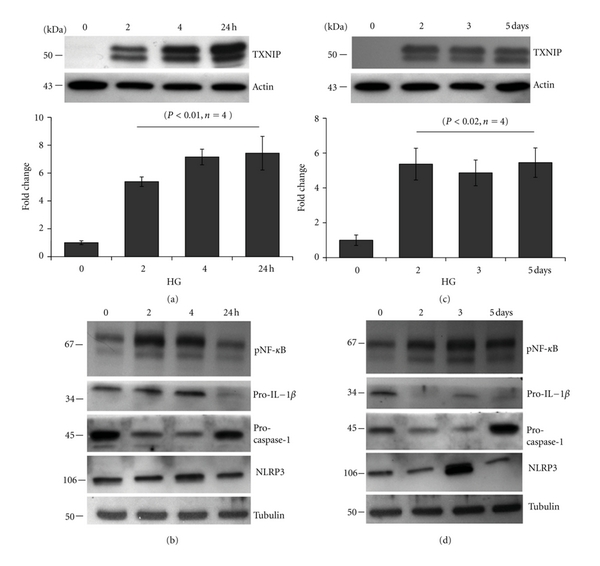
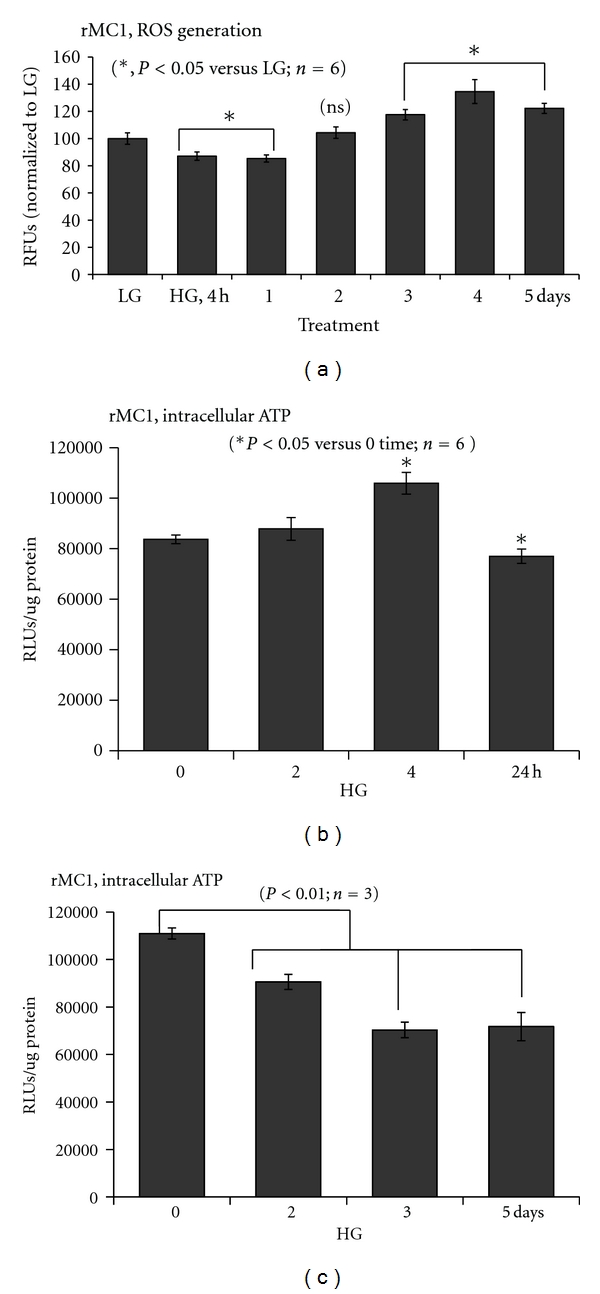
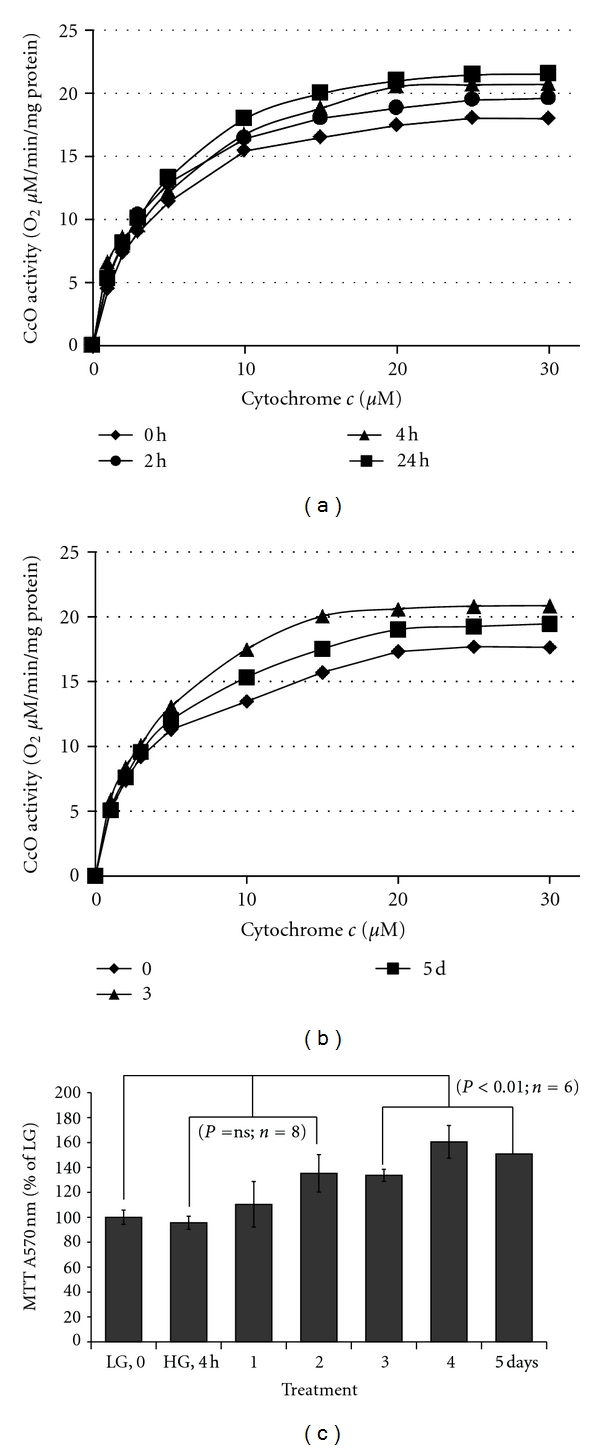
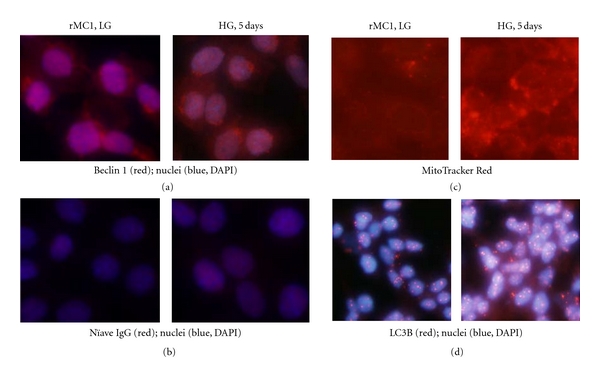
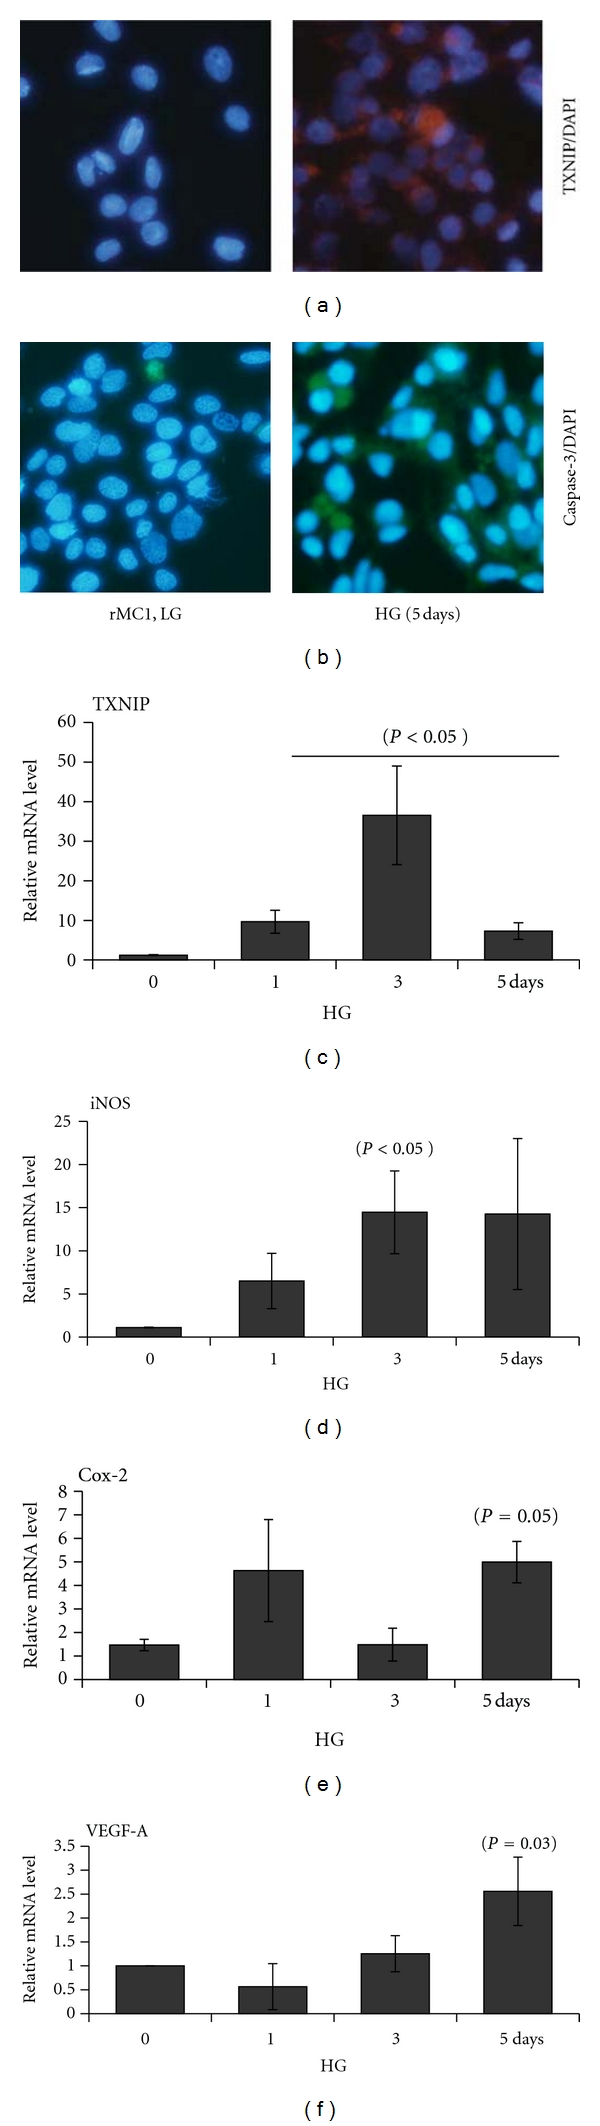
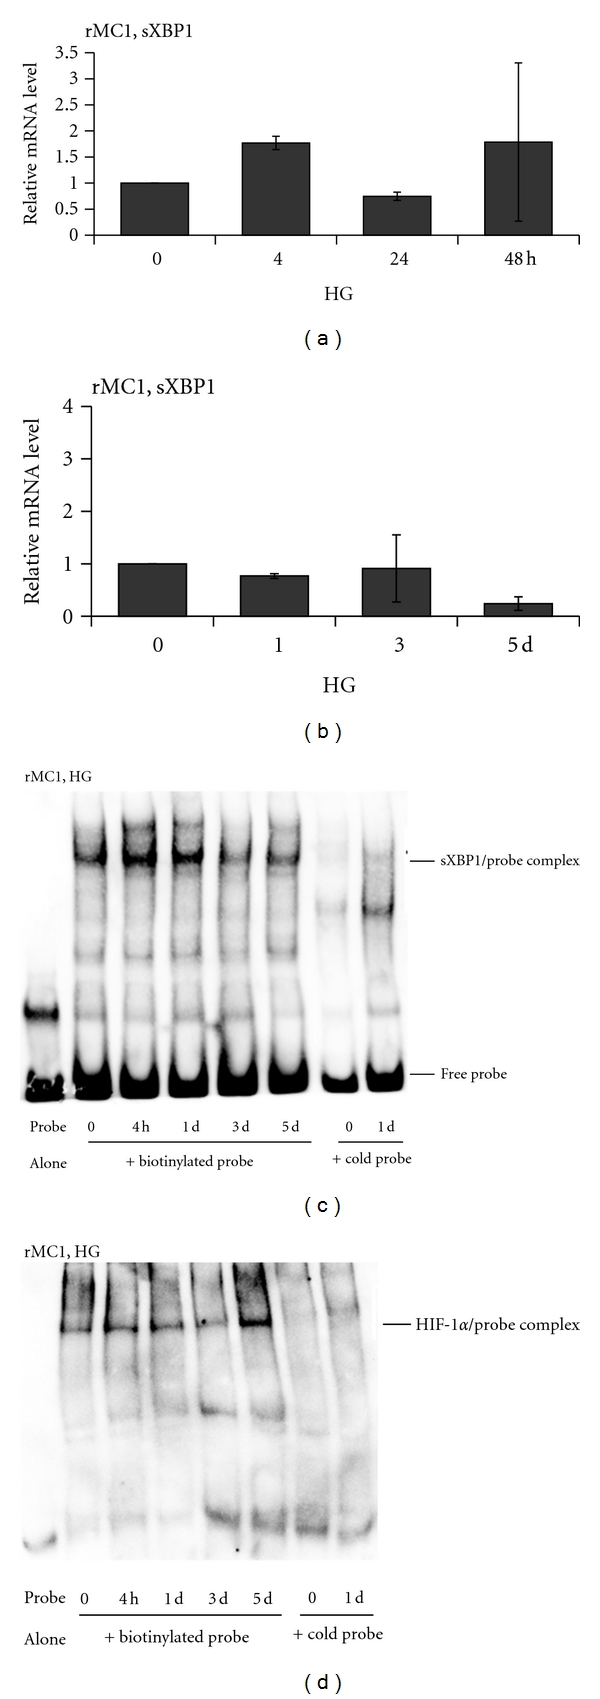
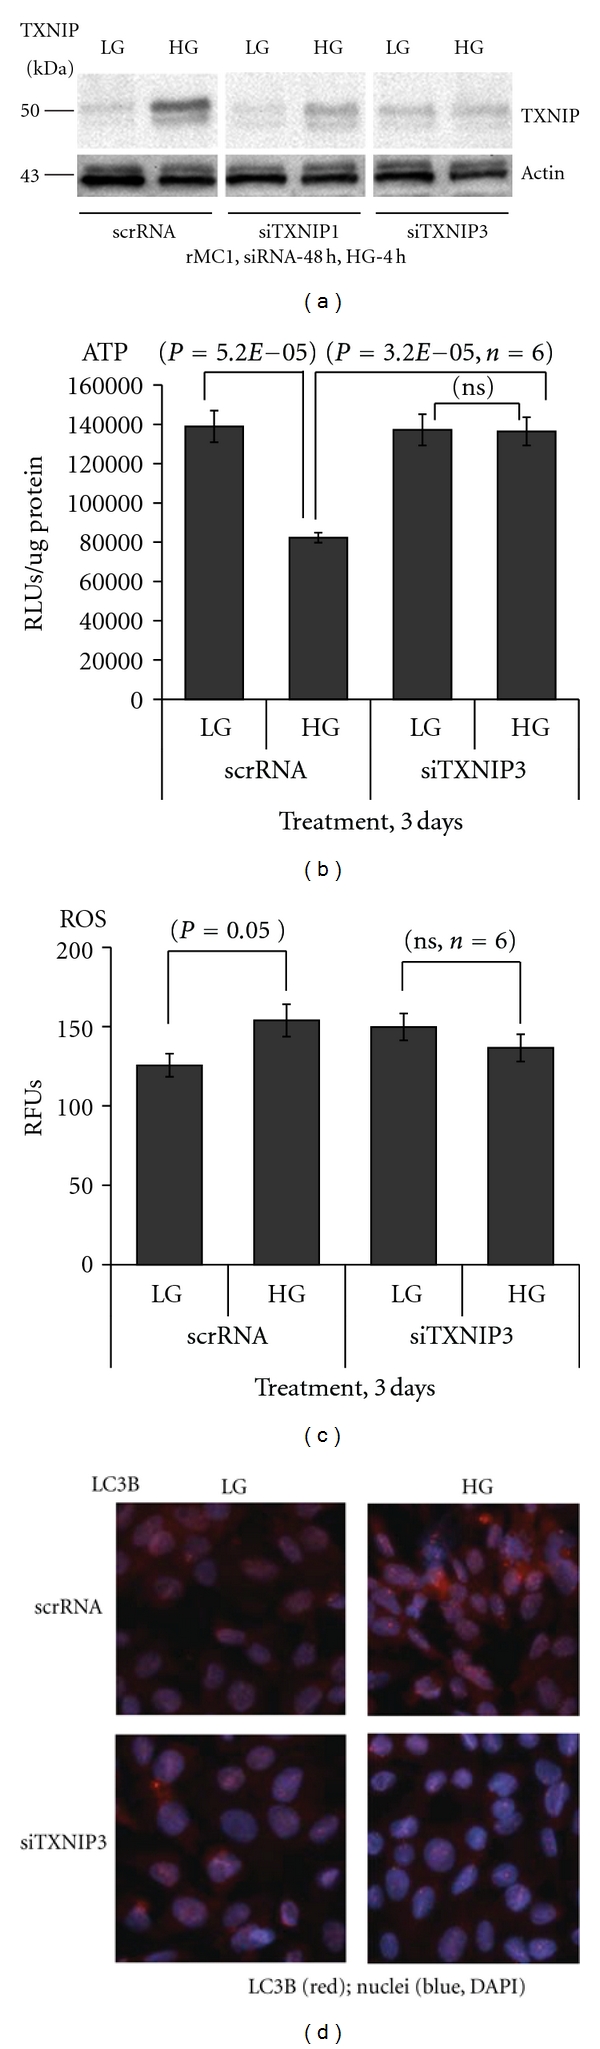
Thioredoxin Interacting Protein (TXNIP) mediates retinal inflammation, gliosis, and apoptosis in experimental diabetes. Here, we investigate the temporal response of Muller glia to high glucose (HG) and TXNIP expression using a rat Muller cell line (rMC1) in culture. We examined if HG-induced TXNIP expression evokes host defense mechanisms in rMC1 in response to metabolic abnormalities. HG causes sustained up-regulation of TXNIP (2 h to 5 days), ROS generation, ATP depletion, ER stress, and inflammation. Various cellular defense mechanisms are activated by HG: (i) NLRP3 inflammasome, (ii) ER stress response (sXBP1), (iii) hypoxic-like HIF-1α induction, (iv) autophagy/mitophagy, and (v) apoptosis. We also found in vivo that streptozocin-induced diabetic rats have higher retinal TXNIP and innate immune response gene expression than normal rats. Knock down of TXNIP by intravitreal siRNA reduces inflammation (IL-1β) and gliosis (GFAP) in the diabetic retina. TXNIP ablation in vitro prevents ROS generation, restores ATP level and autophagic LC3B induction in rMC1. Thus, our results show that HG sustains TXNIP up-regulation in Muller glia and evokes a program of cellular defense/survival mechanisms that ultimately lead to oxidative stress, ER stress/inflammation, autophagy and apoptosis. TXNIP is a potential target to ameliorate blinding ocular complications of diabetic retinopathy.


Figures

Figure 1
Figure 1
Diabetes induces TXNIP and pro-inflammatory gene expression and glia reactivity in the rat retina. (a) Messenger mRNA levels for TXNIP (4.55-fold ± 0.96) and pro-inflammatory IL-1β (9.19 ± 4.62), iNOS (2.22 ± 0.76), and pattern recognition receptors TLR4 (4.04 ± 1.43) and P2X7R (3.26 ± 0.73) are increased significantly (P < 0.05, n = 6) in the retina of diabetic rats (4 weeks) when compared with the normal retina. GS is marginally increased (1.55 ± 0.29) but not significant (P = 0.3). (b) GFAP staining, a marker of gliosis, is also increased radially throughout the neuroretina in the diabetic rat versus the normal retina, suggesting Muller glia activation. GCL: ganglion cell layer; INL: inner nuclear layer; and ONL: outer nuclear layer. (c–e) TXNIP knockdown by siRNA targeted to the promoter (RNAi TGS, [9]) reduces IL-1β and GFAP mRNA levels in the diabetic retina as compared to the scr-siRNA-treated diabetic rat retina. Under these conditions (4 weeks of diabetes induction in rats), we did not see an increase in retinal TNF-α mRNA level.
Figure 2
Figure 2
HG induces TXNIP expression and evokes the host innate immune response in rat Muller glia. Quantitative RT-PCR for (a) TXNIP and (b) IL-1β mRNA expression in rMC1 is shown. HG increases TXNIP mRNA at 2–24 h (P < 0.05 versus time 0, n = 6) while pro-IL-1β mRNA is increased at 2 and 4 h (P < 0.05 versus time 0, n = 6) and then reduces at 24 h. (c) IHC detects a time-dependent accumulation of the p65 subunit of NF-κB in the nucleus in rMC1 under HG. (d) Active caspase-1 staining is increased in rMC1 using the caspase-1 FLICA probe. A representative of n = 3 is shown here.
Figure 3
Figure 3
Chronic hyperglycemia persistently upregulates TXNIP expression in rMC1 and induces IL-1β and NLRP3 inflammasome activation. rMC1 cells were cultured under HG for (a and b) 0–24 h or (c and d) 0–5 days and TXNIP proteins were detected by Western blotting. For this, cell extracts were prepared in RIPA buffer and 30 μg protein was analyzed on 12% SDS-PAGE and Western blot for cytosolic TXNIP, Pro-IL-1β, NLRP3, and pro-caspase-1 and the nuclear level of phosphorylated p65 at serine residue 276 (S276) of NF-κB. ECL detected the immunoreactive bands. Actin and tubulin were used as controls for protein loading. A representative blot for each protein is shown here from n = 3-4.
Figure 4
Figure 4
Time-dependent effect of HG on ROS and ATP generation in rMC1. (a) Reactive oxygen species (ROS) generation was measured using a fluorescence probe, CM-H2DFA. ROS level is reduced at both 4 and 24 h significantly (P < 0.05, n = 6) but rises at day 3 to 5 (P < 0.05, n = 6). (b-c) ATP level was determined in rMC1 cells by a Renilla-based luminescence assay kit (Invitrogen). Intracellular ATP is increased at 4 h (P < 0.05, n = 6) and reduces at 24 h as well as at day 2 through 5 (P < 0.01, n = 3). However, at day 3 and 5, the level of ATP is further reduced to ~65% of the control.
Figure 5
Figure 5
HG effects on mitochondrial electron transport chain (ETC) enzyme activity in rMC1. (a-b) Cytochrome c oxidase (CcO) activity was determined by increasing the amount of substrate cytochrome c in a polarographic method as described in Methods. CoO activity is defined as consumed O2 [μM]/min/protein [mg]. Oxidative metabolism was increased after incubation in high glucose medium as was seen by an incremental increase of CcO activity at 24 h as well as at 3 and 5 day by ~12%. Shown are representative experiments (n = 3; standard deviation <4% at maximal turnover). (c) MTT Assay for rMC1 cell viability was measured in 48-well cultures at various time periods of hyperglycemia exposure. MTT activity was not significantly altered up to 2 days; however at day 3 to 5, there is a significant (P < 0.01, n = 6–8) increase versus LG (time 0 control).
Figure 6
Figure 6
HG activates autophagy/mitophagy in rMC1. Cells were grown in HG for 5 days under low serum conditions in a four-well slide chamber with media changing for every 48 h and 24 h for the final day. Cells were fixed and stained for (a) beclin 1 antibody and (b) a naïve IgG for control antibody reaction. There are more beclin 1 puncta in HG than in LG. (c) MitoTracker Red staining also reveals more mitochondrial puncta in HG than in LG. (d) LC3B antibody staining shows an increased LC3B level and autophagic puncta formation in rMC1 under HG than in LG. The pictures are representative of 3 separate experiments.
Figure 7
Figure 7
HG-induced TXNIP expression correlates with proapoptotic caspase-3 expression in rMC1. (a) IHC of TXNIP. Txnip staining is enhanced in rMC1 under HG exposure for 5 days, which correlates with increased (b) proapoptotic caspase 3 staining in similar duration of HG using a caspase-3 FLICA staining kit. A representative of n = 3 is shown here. (c–f) HG induces TXNIP and pro-inflammatory gene expression in rMC1. Total RNA was isolated with TRIZOL and mRNA levels for (c) TXNIP, (d) iNOS, (e) Cox-2, and (f) VEGF-A were measured by qRT-PCR at various time periods of HG exposure (n = 3-4). P values were compared against respective controls at time 0.
Figure 8
Figure 8
HG induces an early ER stress and a later hypoxia-like response in rMC1. Messenger RNA for the spliced form of ER stress marker XBP1 (sXBP1) was measured in rMC1 at various time periods (a) 0–24 h and (b) 0–5 days after HG exposure by qRT-PCR There is no significant change in sXBP1 mRNA (p = ns, n = 3) when compared with respective controls at time 0. (c) The DNA-binding activity of sXBP1 in rMC1 was further measured by EMSA using nuclear extracts (5 μg) and biotin-labeled DNA probes with or without a competitive cold DNA probe as described in Methods. Protein-DNA complexes were detected by streptavin-HPR and ECL. In the presence of competitive cold probe, the sXBP1 reactive band is abolished indicating the specificity of the sXBP1-DNA binding (last two lanes). Probe alone without the nuclear extract was also run as a control (first lane). The sXBP1 activity is increased at 4 h and 1 day in rMC1 by HG and then returns to the control level observed at day 0. (d) The DNA-binding activity of the hypoxic response factor HIF-1α in nuclear extracts was also measured using a biotin-labeled HIF-1α binding consensus DNA probe. HIF-1α activity is not increased up to day 3 in rMC1 by HG but enhances at day 5. Competitive cold probes block the DNA-binding of HIF-1α, indicating the specificity of the binding assay. The images are representative of n = 3 in both (c) and (d).
Figure 9
Figure 9
TXNIP knockdown by siRNA blocks HG-mediated ATP reduction, ROS generation, and LC3B expression in rMC1. (a) Seventy to eighty percent confluent rMC1 cells were transfected transiently with an scramble siRNA (scrRNA, control) or with TXNIP mRNA-targeted siRNAs-siTXNIP1 and siTXNIP3 (20 nM each) using HiPerfect transfection reagent in six-well plates or 60 mm culture plates in duplicates. After 6 h, complete media containing 5% serum were replaced and kept for 24 h. Media was subsequently changed to low serum media (0.2% serum) for 48 h. Afterwards, HG was added for 4 h and TXNIP amount was measured by Western blotting. We observe that siTXNIP3 gives a consistent suppression of TXNIP (~70%) and used in further studies. A representative blot of n = 4 is shown here. Actin was used as a control for protein loading and siRNA specificity. (b) rMC1 cells were transiently transfected in 24-well plates with siTXNIP3 for 48 h and then HG was added for 72 h in low serum media. Intracellular ATP concentration was measured and normalized to protein concentration (RLUs/μg protein). HG reduces ATP level in scrRNA-treated rMC1 cells while siTXNIP3 transfection blunted HG effects. (c) Similar to ATP determination, we also measured ROS levels after 72 h of HG exposure in both scrRNA and siTXNIP3-transfected rMC1 with CM-H2DCFDA. HG increases ROS levels in scrRNA cells (P < 0.05, n = 6) versus LG but this effect was not observed in siTXNIP3 cells. (d) LC3B staining under HG exposure for 5 days is also reduced in siTXNIP3-transfected cells when compared with the scrRNA cells under similar duration of HG exposure (right panels). Under LG, LC3B staining is minimal in both scrRNA and siTXNIP3-treated rMC1 cells after 5 days. A representative of n = 3 is shown here.
Figure 10
Figure 10
A schematic summary of potential cellular responses by retinal Muller glia in chronic hyperglycemia and diabetes. The sequence of molecular events that retinal Muller cells react to chronic hyperglycemia include (i) sustained upregulation of TXNIP, (ii) an initial innate immune and UPR response to excess glucose metabolism and oxidative phosphorylation (ATP generation), (iii) oxidative stress (ROS/RNS generation) and a hypoxia-like response through ATP reduction, (iv) an induction of an autophagic-mitophagic pathway, and (v) ER-stress and inflammation. These cellular responses constitute intrinsic cell survival/defense mechanisms, which, under chronic cell stress and injury, may promote premature cell death and disease progression of DR.

Similar articles

Cited by

References

    1. Cheung N, Mitchell P, Wong TY. Diabetic retinopathy. The Lancet. 2010;376(9735):124–136. - PubMed
    1. Kern TS, Barber AJ. Retinal ganglion cells in diabetes. Journal of Physiology. 2008;586(18):4401–4408. - PMC - PubMed
    1. Tang J, Kern TS. Inflammation in diabetic retinopathy. Progress in Retinal and Eye Research. 2011;30(5):343–358. - PMC - PubMed
    1. Frey T, Antonetti DA. Alterations to the blood-retinal barrier in diabetes: cytokines and reactive oxygen species. Antioxidants and Redox Signaling. 2011;15(5):1271–1284. - PubMed
    1. Xu H, Chen M, Forrester JV. Para-inflammation in the aging retina. Progress in Retinal and Eye Research. 2009;28(5):348–368. - PubMed

Publication types

MeSH terms