. 2012:2012:829584.
doi: 10.1155/2012/829584. Epub 2012 Mar 5.

Emergence of exhausted B cells in asymptomatic HIV-1-infected patients naïve for HAART is related to reduced immune surveillance

Affiliations

Emergence of exhausted B cells in asymptomatic HIV-1-infected patients naïve for HAART is related to reduced immune surveillance

Manuela Fogli et al. Clin Dev Immunol. 2012.

Abstract

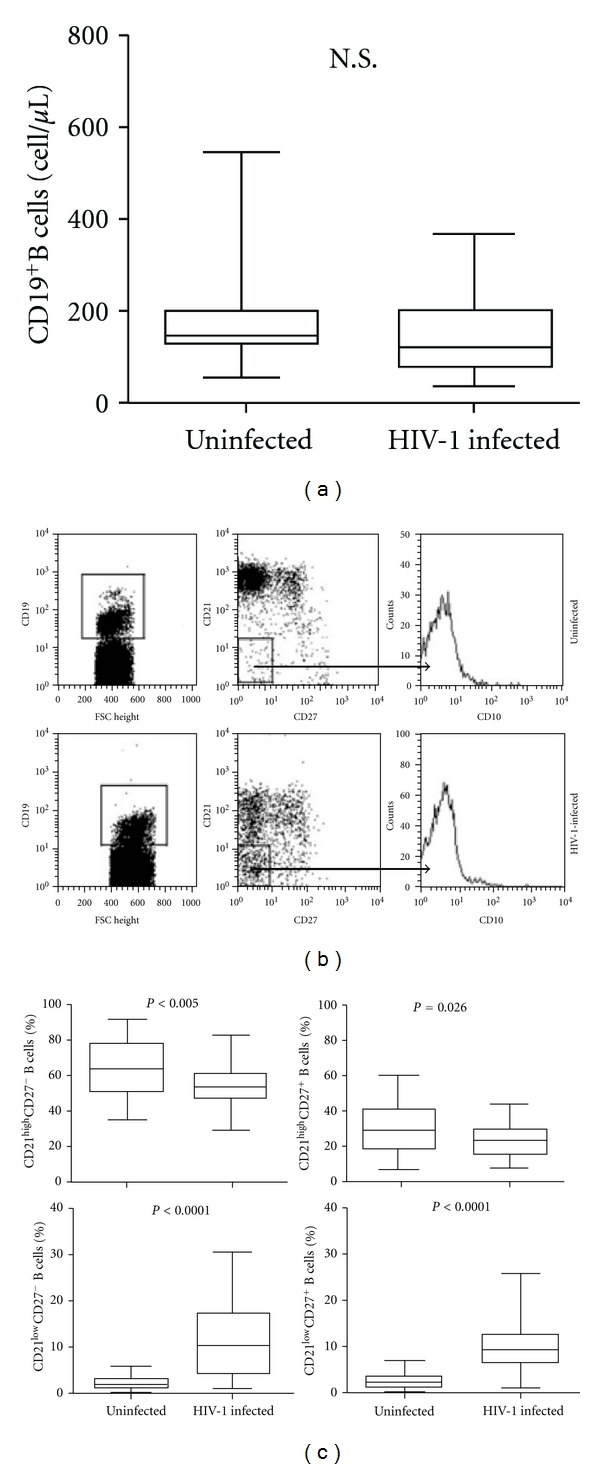
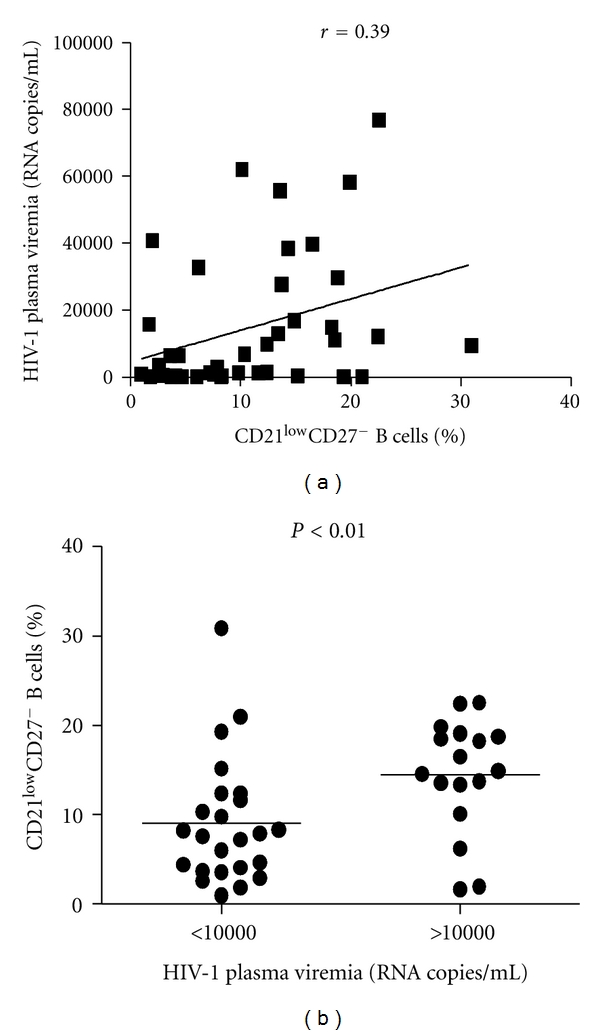
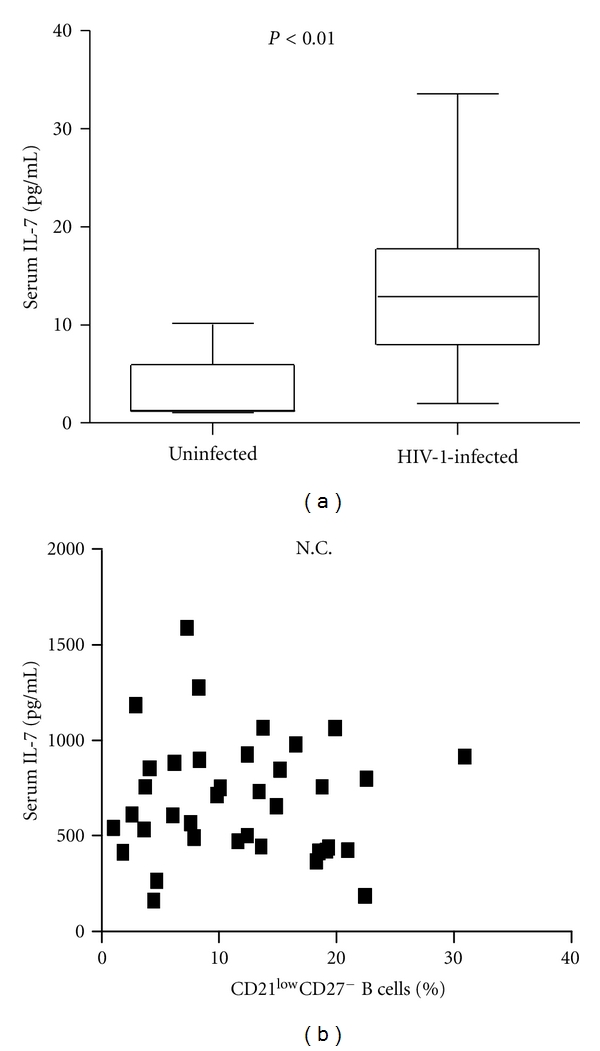
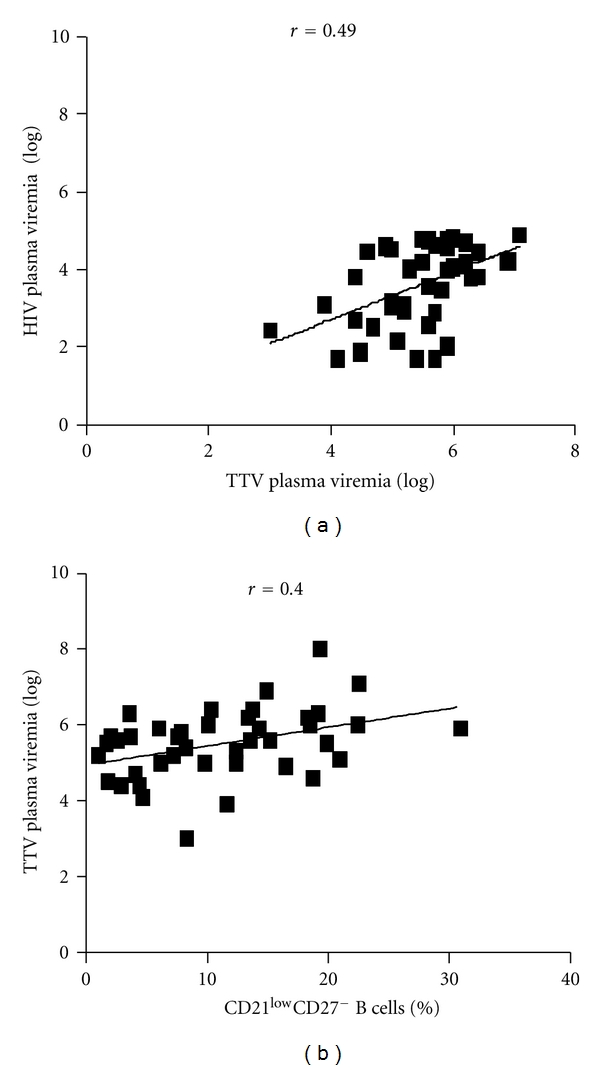
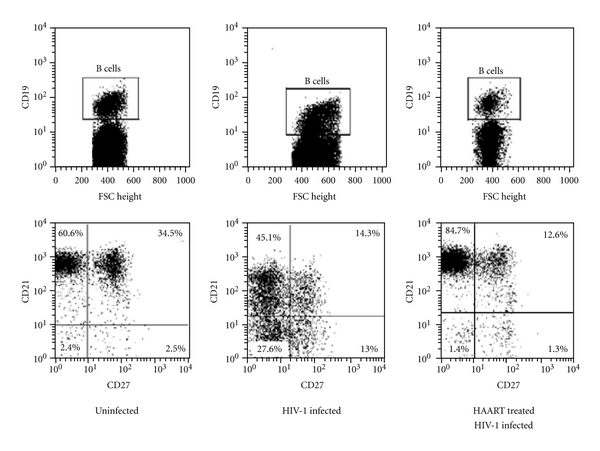
Alterations of B cell subpopulations have been described up to date as characterizing advanced stage of HIV-1 infection. However, whether such defects are relevant in subjects with a preserved number of CD4⁺ T cells (>350 cells/μL) is unclear. In a cross-sectional study, we investigated if signs of B cells exhaustion and impaired viral immune surveillance are present in a cohort of 43 asymptomatic HIV-1-infected patients with preserved CD4⁺ T cell counts (>350 cells/μL) and highly active antiretroviral therapy (HAART) untreated. A dramatic expansion of exhausted tissue-like memory B cells (CD10⁻CD21(low)CD27⁻) was observed. B cells alteration was related to an increase in Torque teno virus (TTV) load, used as surrogate marker of immune function. Successfully HAART-treated patients showed normalization of B cell subpopulations frequency and TTV load. These results provide new insights on B cell in HIV-1 infection and show that development of B cell abnormalities precedes CD4⁺ T cell decline.


Figures

Figure 1
Figure 1
Peripheral blood B cell subsets alterations in asymptomatic HIV-1-infected patients. (a) Comparative analysis of CD19+ B cell counts (cell number/μL) in HIV-1-uninfected individuals and asymptomatic HIV-1-infected patients. (b) Analysis of CD21 and CD27 expression on B cells from HIV-1-uninfected individuals and asymptomatic HIV-1-infected patients, and analysis of CD10 expression on CD21low/CD27 B cells. Percentages of B cell subsets were determined by four-color flow cytometry analysis of CD19, CD21, CD27, and CD10 surface expression molecules. Profiles of expression of CD21 and CD27 are shown for one representative of each group. Cells were gated according to the lymphocytes forward and side scatter pattern and the CD19+ cells. (c) Comparative analysis of B cell subpopulations in HIV-1-uninfected individuals and asymptomatic HIV-1-infected patients. Frequency of CD21highCD27 naïve B cells (upper left panel), CD21highCD27+ resting memory B cells (upper right panel), CD10CD21lowCD27 exhausted tissue-like memory B cells (lower left panel), and CD21lowCD27+ mature/activated B cells (lower right panel) are shown for the total of donors. Differences between groups were evaluated using the two-tailed Mann-Whitney U test, and were considered significant at P < 0.05. Into the box plots, horizontal lines represent median values for each group, boxes show the 25th and 75th percentiles, and bars show SD. N.S. = not significant.
Figure 2
Figure 2
Association between exhausted tissue-like memory B cells and HIV plasma viremia. Correlation between CD10CD21lowCD27 B cell percentages and HIV-1 plasma viremia (RNA copies/mL) in asymptomatic HIV-1-infected patients (a). Comparative analysis of CD10CD21lowCD27 B cell percentages in asymptomatic patients with HIV-1 plasma viremia ≤ to 10000 RNA copies/mL and asymptomatic patients with HIV-1 plasma viremia > to 10000 RNA copies/mL (b). Association of 2 different data groups were analyzed by Spearman's rank test; P and rho values are indicated. Each symbol represents one individual, and regression line is shown. Differences between groups were evaluated using the two-tailed Mann-Whitney U test, and were considered significant at P < 0.05. Into the box plots, horizontal lines represent median values for each group, boxes show the 25th and 75th percentiles, and bars show SD.
Figure 3
Figure 3
IL-7 serum levels in asymptomatic HIV-1-infected patients and correlation with CD10CD21lowCD27B cells frequency. (a) Comparative analysis of IL-7 serum levels (pg/mL) in HIV-1-uninfected donors and asymptomatic HIV-1-infected patients. ELISA was performed to measure the IL-7 concentration. (b) Correlation between IL-7 serum levels and percentage of CD10CD21lowCD27 B cells in asymptomatic HIV-1-infected patients. Differences between groups were evaluated using the two tailed Mann-Whitney U test, and were considered significant at P < 0.05. Into the box plots, horizontal lines represent median values for each group, boxes show the 25th and 75th percentiles, and bars show SD. Association of 2 different data groups were analyzed by Spearman's rank test. Each symbol represents one individual, and regression line is shown. N.C.= no correlation.
Figure 4
Figure 4
Perturbation in TTV immune surveillance in asymptomatic HIV-1-infected patients. (a) Correlation between TTV and HIV-1 viral loads (log⁡ DNA copies/mL, and log⁡ RNA copies/mL, resp.) in plasma derived from asymptomatic HIV-1-infected patients. TTV and HIV viral loads were measured by PCR and RT-PCR, respectively. (b) Correlation between plasma TTV titer and percentage of CD10CD21lowCD27 B cells in asymptomatic HIV-1-infected patients. Association of 2 different data groups were analyzed by Spearman's rank test; P and rho values are indicated. Each symbol represents one individual, and regression line is shown.
Figure 5
Figure 5
Effect of HAART in B cell subsets distribution in HIV-1-infected patients. Comparative analysis of CD21 and CD27 expression on B cells from HIV-1-uninfected individuals, asymptomatic HIV-1-infected patients, and HAART-treated patients. Profiles of expression of CD21 and CD27 are shown for one representative of each groups (lower panel). Cells were gated according to the lymphocytes forward and side scatter pattern and the CD19+ cells (upper panel).

Similar articles

Cited by

References

    1. Lawn SD, Butera ST, Folks TM. Contribution of immune activation to the pathogenesis and transmission of human immunodeficiency virus type 1 infection. Clinical Microbiology Reviews. 2001;14(4):753–777. - PMC - PubMed
    1. Lane HC, Masur H, Edgar LC, Whalen G, Rook AH, Fauci AS. Abnormalities of B-cell activation and immunoregulation in patients with the acquired immunodeficiency syndrome. New England Journal of Medicine. 1983;309(8):453–458. - PubMed
    1. Shirai A, Cosentino M, Leitman-Klinman SF, Klinman DM. Human immunodeficiency virus infection induces both polyclonal and virus-specific B cell activation. Journal of Clinical Investigation. 1992;89(2):561–566. - PMC - PubMed
    1. Amadori A, De Rossi A, Faulkner-Valle GP, Chieco-Bianchi L. Spontaneous in vitro production of virus-specific antibody by lymphocytes from HIV-infected subjects. Clinical Immunology and Immunopathology. 1988;46(3):342–351. - PubMed
    1. Fournier AM, Fondere JM, Alix-Panabieres C, et al. Spontaneous secretion of immunoglobulins and anti-HIV-1 antibodies by in vivo activated B lymphocytes from HIV-1-infected subjects: monocyte and natural killer cell requirement for in vitro terminal differentiation into plasma cells. Clinical Immunology. 2002;103(1):98–109. - PubMed

Publication types

MeSH terms

Substances