. 2012 Apr 1;2012(4):459-64.
doi: 10.1101/pdb.prot067702.

Measuring resting membrane potential using the fluorescent voltage reporters DiBAC4(3) and CC2-DMPE

Affiliations

Measuring resting membrane potential using the fluorescent voltage reporters DiBAC4(3) and CC2-DMPE

Dany S Adams et al. Cold Spring Harb Protoc. .

Abstract

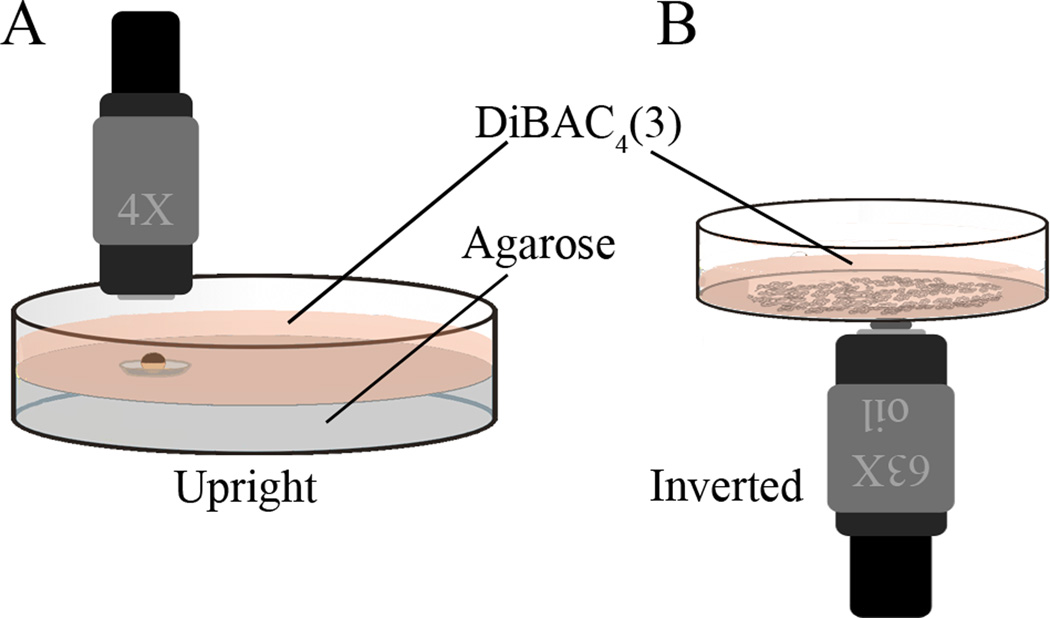
Slow changes in steady-state (resting) transmembrane potential (V(mem)) of non-excitable cells often encode important instructive signals controlling differentiation, proliferation, and cell:cell communication. Probing the function of such bioelectric gradients in vivo or in culture requires the ability to track V(mem), to characterize endogenous patterns of differential potential, map out isopotential cell groups (compartments or cell fields), and confirm the results of functional perturbation of V(mem). The use of fluorescent bioelectricity reporters (FBRs) has become more common as continuing research and innovation have produced better and more options. These dyes are now used routinely for cell sorting and for studies of cultured cells. Important advantages over single cell electrode measurements are offered by dyes, including: (1) subcellular resolution, (2) the ability to monitor multicellular areas and volumes in vivo, (3) simplicity of use, (4) ability to measure moving targets, and (5) ability to measure over long time periods. Thus, FBRs are suitable for longitudinal studies of systems that change and move over time, for example, embryos. Existing protocols focus on measurements of rapid action potentials in cultured cells or neurons. This article describes a dye pair that can be used to measure resting V(mem) in cultured cells and in vivo in Xenopus laevis embryos and tadpoles (and is readily applied to other model systems, such as zebrafish, for studies of developmental bioelectricity). It is assumed that the reader is fully familiar with the process and terminology of fluorescence microscopy.


Figures

Figure 1
Figure 1
Dishes for imaging large specimens and cells in culture. (A) A Petri dish with a depression is useful for holding larger, or moving specimens. A convenient way to make these is to pour 2% agarose into a Petri dish; then, before the agarose starts to solidify, float the cap of a microcentrifuge tube, outside up, at the surface. The volume enclosed by the ridge underneath will hold a bubble of air. When the gel is solid, remove the cap and there will be a circular well the diameter of that internal ridge. The caps of 0.5 mL PCR tubes make a depression exactly big enough (5 mm in diameter) to hold seven Xenopus embryos. If shorter working distance lenses will be used, it is useful to fill the dish as high as possible with agarose so that the sample will be near the coverslip but still exposed to the DiBAC solution. (B) The bottom of a FluoroDish is made of coverslip glass, and thus is an excellent surface on which to grow cultured cells for this kind of imaging. If using an inverted microscope, the dish can simply be filled with DiBAC solution; for use on an upright scope, a round coverslip placed over the well will hold enough DiBAC solution for short term imaging with the dish turned upside down, although it should be remembered that it is a much smaller volume and thus bleaching may prove a problem.
Figure 2
Figure 2
Image of DiSBAC2(3) accumulation in cortical intracellular vesicles in the ectoderm of a Xenopus laevis embryo. Not all membranes are equal; thus a dye that accumulates in the plasma membrane of one cell type may accumulate in a different membrane of a different cell type. In this image, it is clear that the DiSBAC2(3) has accumulated in cortically located intracellular vesicles (arrowheads) of these ectodermal cells (single cell circled). The signal from these vesicles is very bright; thus it is not possible to use this dye for imaging the voltage of the plasma membrane of these cells. Scale bar = 20 μm.
Figure 3
Figure 3
Ratio images from a time-lapse recording of a Xenopus blastula undergoing cleavage. Nine frames from a DF and FF corrected time-lapse ratio video have been pseudocolored to emphasize the variation in Vmem across the embryo and across individual cells; red is relatively negative Vmem, blue is relatively positive Vmem. The areas in the green boxes are reproduced in a single line at the bottom in black and white. In addition to the relatively stable difference in Vmem of cells in different positions in the embryo, the variation of Vmem across the surface of individual blastomeres is striking, especially the relatively positive membrane associated with positions of cell-cell contact (green arrows). Illustrated in the black and white images is a typical pattern of changing Vmem in the new membrane that is inserted as the cleavage furrow forms. Initially, membrane at the cleavage furrow is relatively negative (lighter). As the furrow forms, relatively positive membrane (darker) is inserted, but the lighter negative membrane region is maintained for some time. Images are separated by 3 min.
Figure 4
Figure 4
Three images of a culture of COS m6 cells before, during, and after depolarization. An example of control 1. The addition of high potassium (120 mM) PBS to the cultured mammalian cells depolarizes the membrane. This should cause the ratio of CC2 signal to DiBAC4(3) signal to become lower; thus the brightness of the signal should decrease. This is exactly what happened. For cells whose internal ion concentrations are known, the Goldman-Katz-Hodgkin1 equation (http://www.physiologyweb.com/calculators/ghk_equation_calculator.html) can be used to calibrate the dyes based on images like these taken at varying external potassium concentrations.

References

    1. Adams DS, Levin M. General principles for measuring resting membrane potential and ion concentration using fluorescent bioelectricity reporters. Cold Spring Harb Protoc. 2012 - PMC - PubMed
    1. Kuznetsov A, Bindokas VP, Marks JD, Philipson LH. FRET-based voltage probes for confocal imaging: membrane potential oscillations throughout pancreatic islets. Am J Physiol Cell Physiol. 2005;289:C224–C229. - PubMed
    1. Maher MP, Wu N-T, Ao H. pH-Insensitive FRET voltage dyes. J Biomol Screen. 2007;12:656–667. - PubMed
    1. Vandenberg LN, Morrie RD, Adams DS. V-ATPase-dependent ectodermal voltage and pH regionalization are required for craniofacial morphogenesis. Dev Dyn. 2011;240:1889–1904. - PMC - PubMed

Publication types

Substances

LinkOut - more resources