Review
. 2012 Apr 1;2012(4):385-97.
doi: 10.1101/pdb.top067710.

General principles for measuring resting membrane potential and ion concentration using fluorescent bioelectricity reporters

Affiliations
Review

General principles for measuring resting membrane potential and ion concentration using fluorescent bioelectricity reporters

Dany S Adams et al. Cold Spring Harb Protoc. .

Abstract

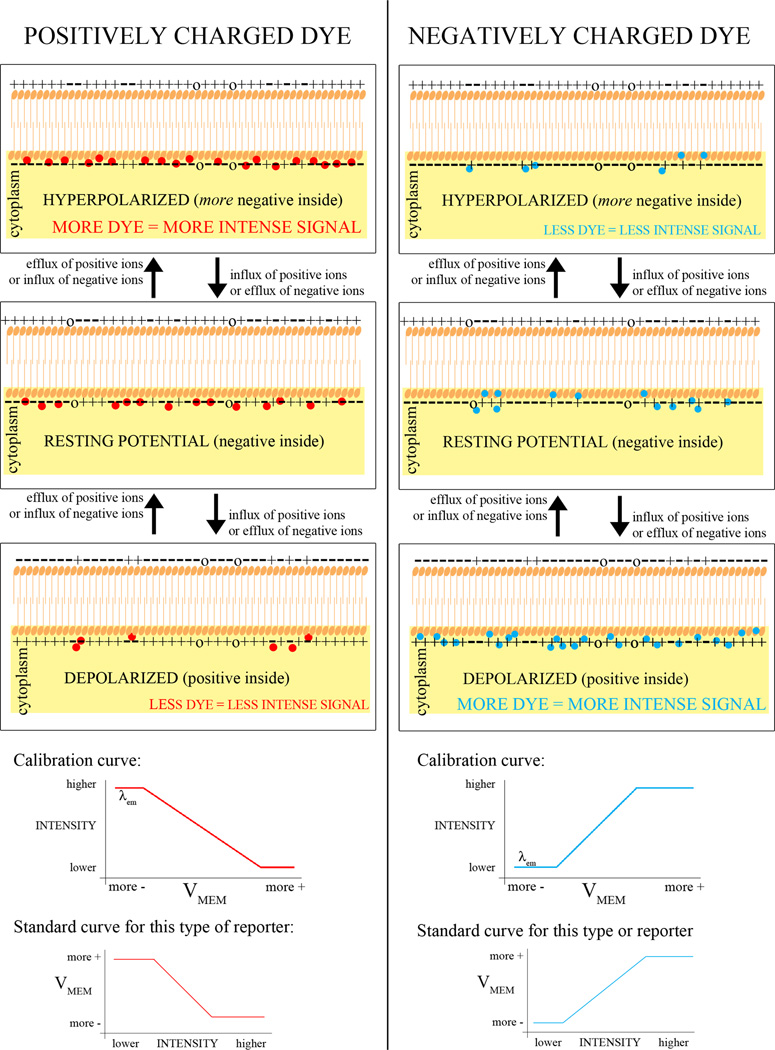
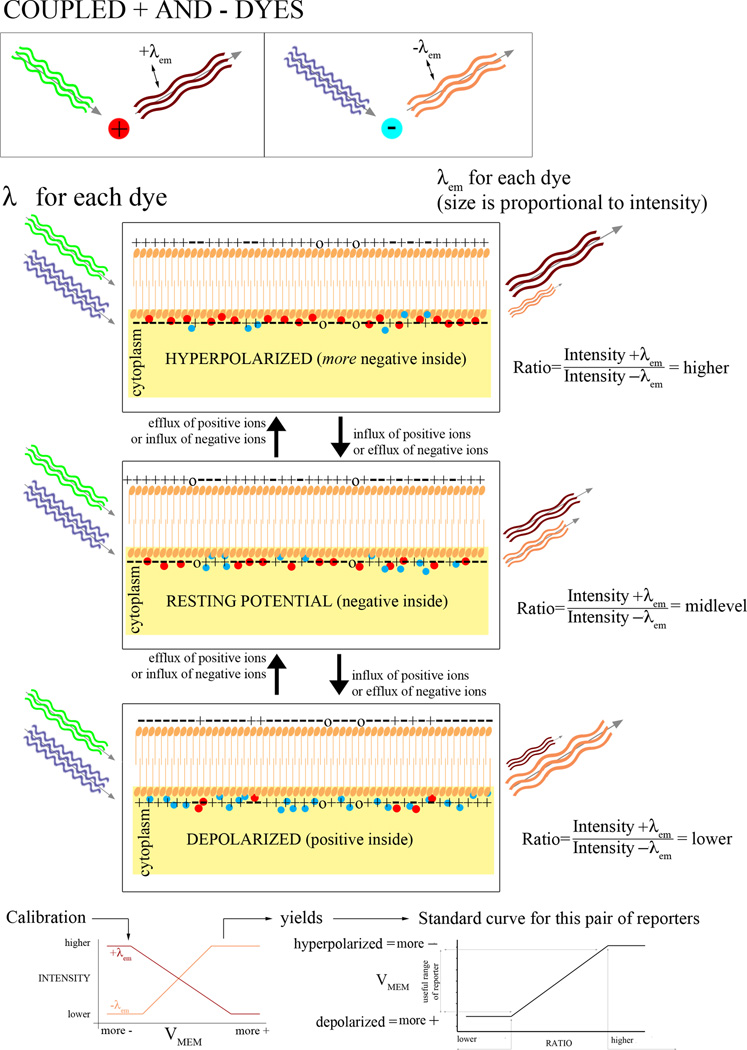
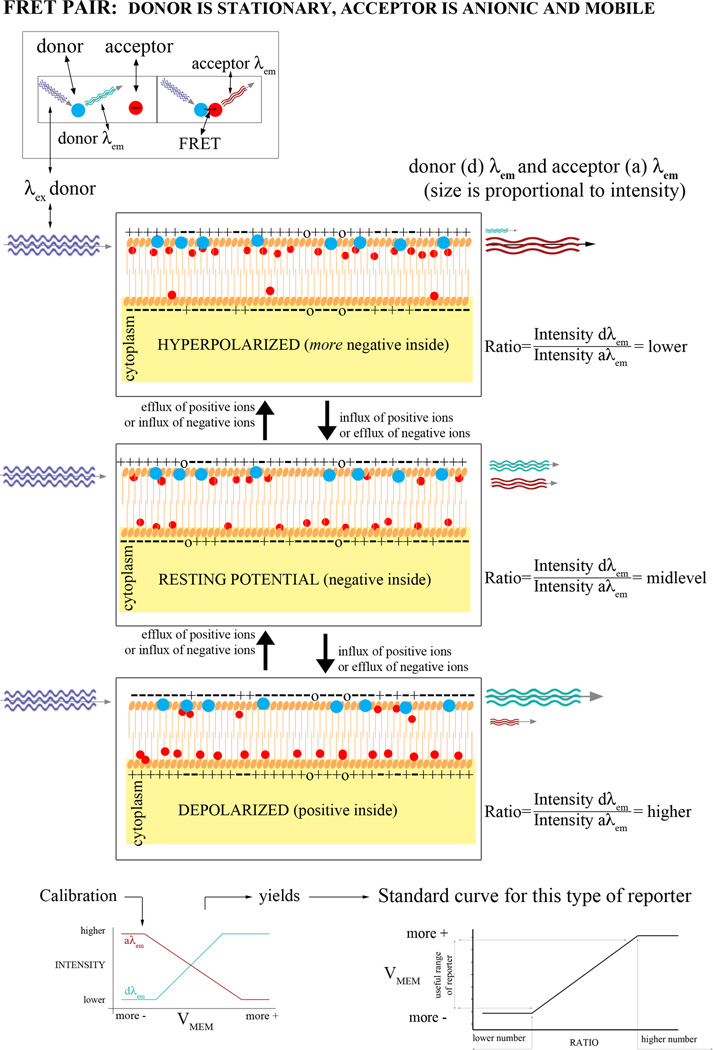
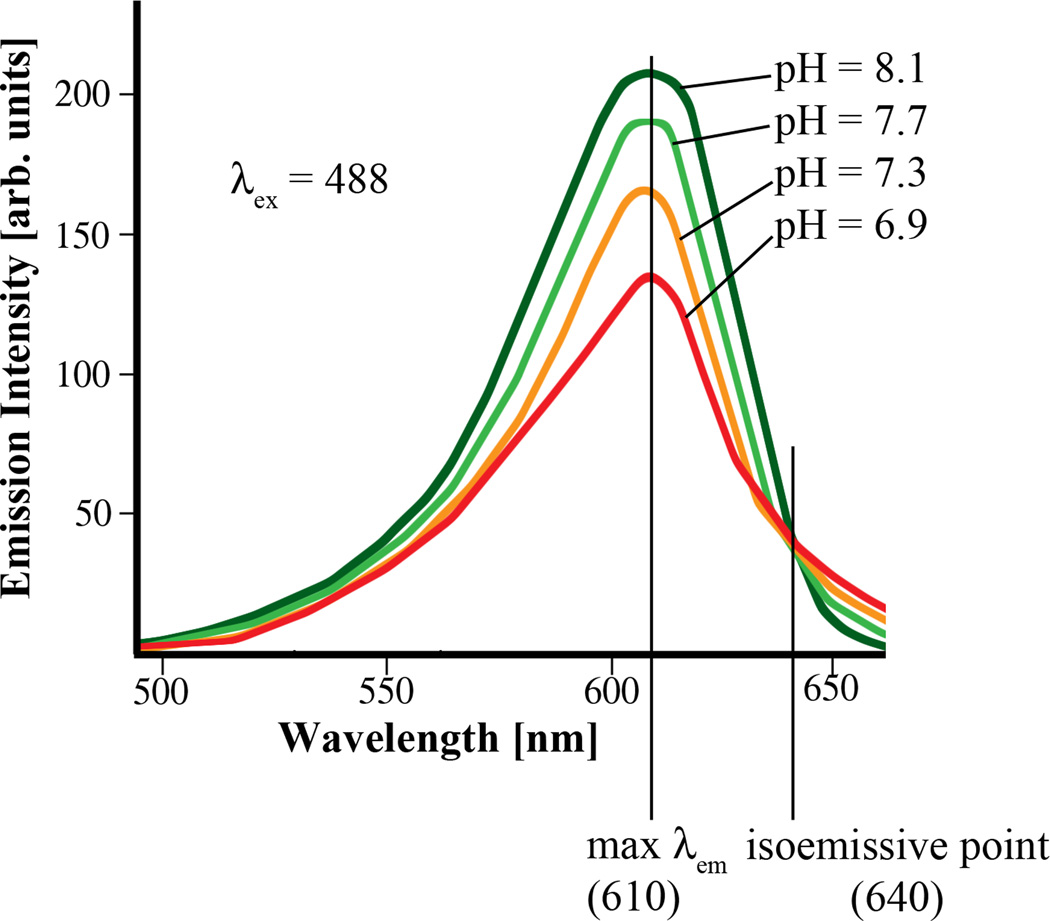
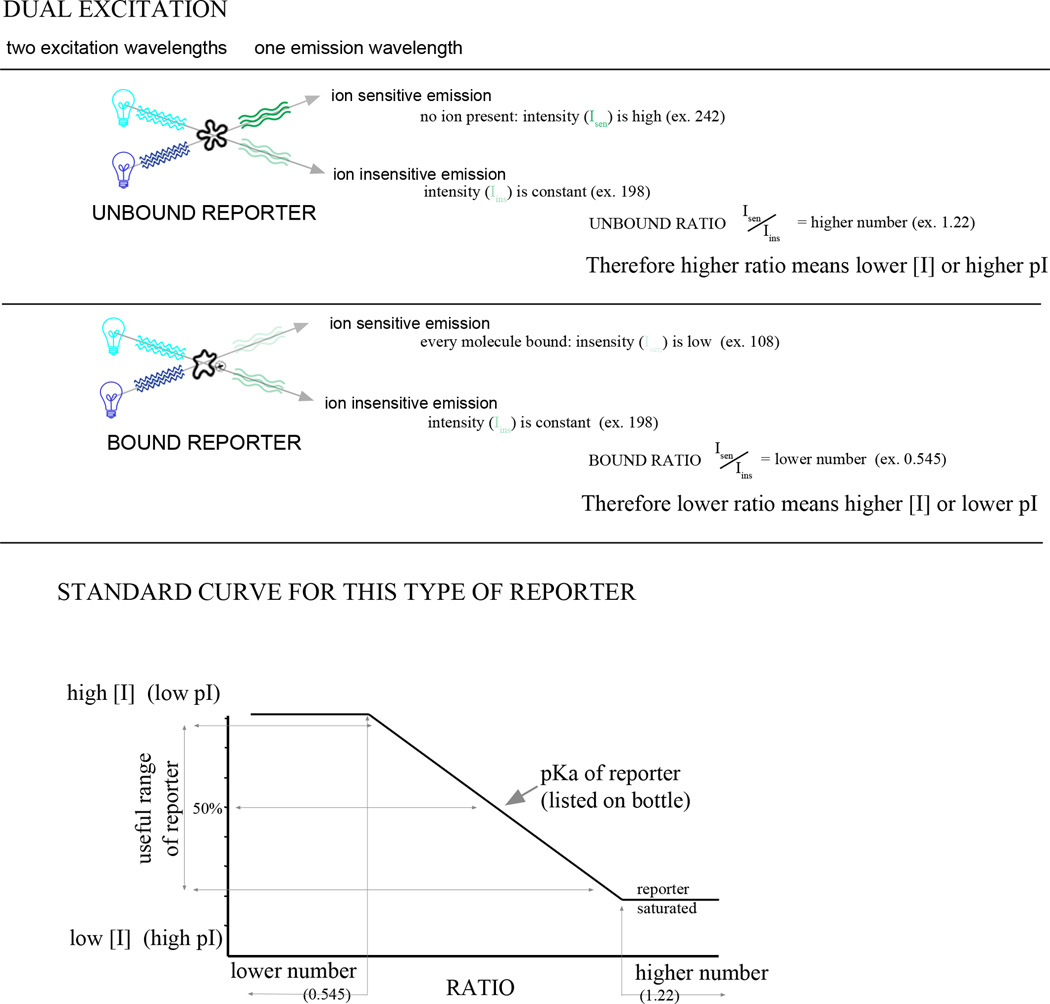
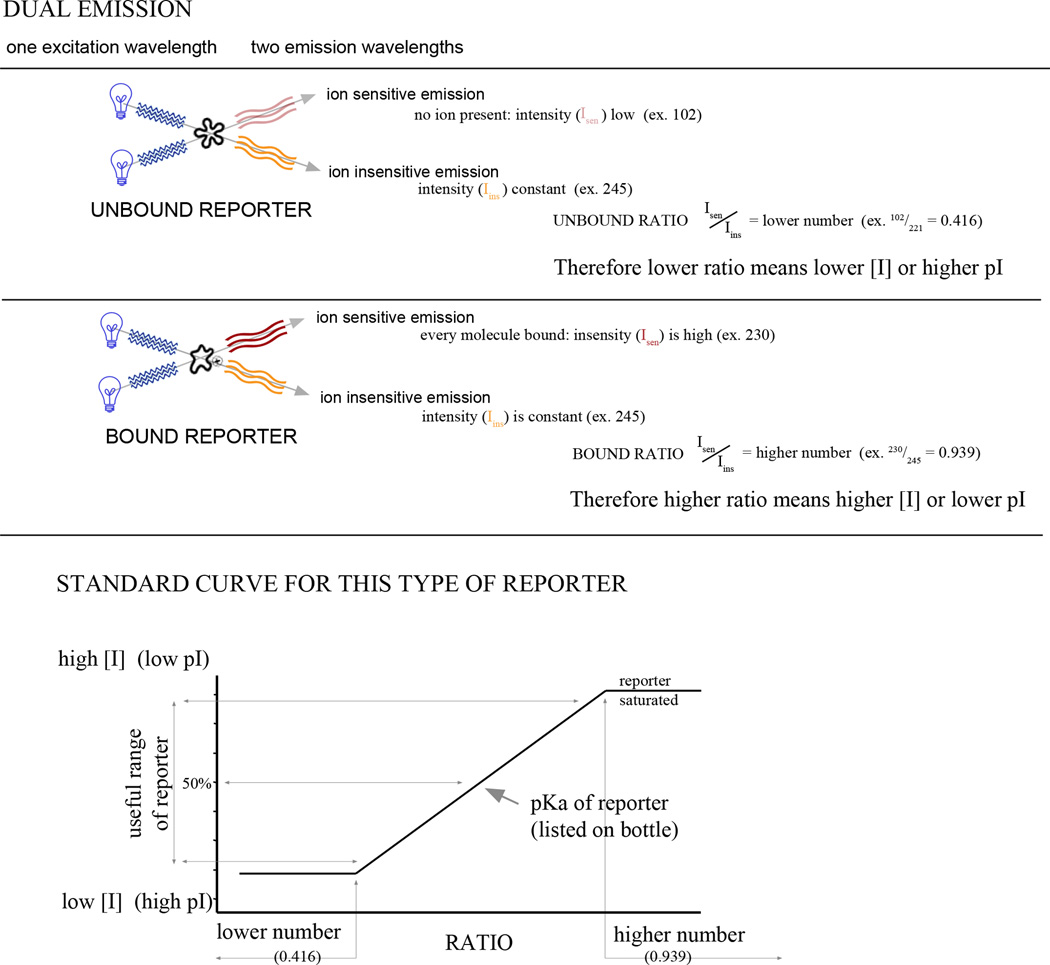
This overview provides the basic information needed to understand, choose, and use fluorescent bioelectricity reporters (FBRs), where bioelectricity is defined as cell processes that involve ions or ion flux. While traditional methods of measuring these characteristics are still valid and necessary, the utility of FBRs has facilitated measurement of these properties under circumstances that are not possible with microelectrodes. Specifically, these dyes can be used to achieve subcellular resolution, to measure many cells simultaneously in vivo, and to track bioelectric gradients over long time periods despite cell movements and divisions. This article covers the basic principles underlying the interpretation of the dye signals, describes essential steps for troubleshooting, optimizing data collection, analysis, and presentation, and provides compilations of information that are useful for choosing FBRs for particular projects.


Figures

Figure 1
Figure 1
Basic mechanism of mobile cationic and anionic FBRs of Vmem. Intensity of the signal is proportional to the number of molecules of reporter in the membrane. The molecules are free to move in and out of the cell; outside the cell they are not fluorescent. If the inner leaflet of the membrane is negatively charged, anionic dyes exit the cell while cationic dyes enter, leading to the opposite change in fluorescence intensity.
Figure 2
Figure 2
Pairing two dyes of opposite charge. If two dyes are used, the signals from the two can be compared or combined to give greater accuracy.
Figure 3
Figure 3
FRET-based detection of Vmem. By combining two fluorophores that are a FRET pair, this approach ensures that the signals collected are being emitted from the same membrane.
Figure 4
Figure 4
Spectra of dual emission pH reporter dye. This is an example of a dual-emission ratiometric ion reporter. When illuminated at λex = 488 nm, signal collected at emission wavelength (λem) = 640 nm does not change with pH; the intensity of the signal collected at the maximum λem = 610 nm does change depending on the proportion of dye molecules that are protonated; thus, in proportion to the pH. The signal collected at the isoemissive wavelength (640 nm) is thus an image of all variation that is due to noise or error in the system, including the important variable of differential uptake of dye. By normalizing the signal at 610 nm to the signal at 640 nm, much of the error is removed.
Figure 5
Figure 5
Dual excitation FBR for measuring ion concentration. The basic mechanism of dual excitation dyes is illustrated. The isosbestic point is the λex at which the signal at λem is insensitive to changes in ion concentration. In this example, λex of the bound reporter is lower than λex of the unbound reporter. If the opposite were the case, the standard curve would have a positive slope.
Figure 6
Figure 6
Dual-emission FBR for measuring ion concentration. The basic mechanism of dual emission dyes is illustrated. The isoemissive point is the λem at which the signal is insensitive to changes in ion concentration. In this example, λex of the bound reporter is higher than λex of the unbound reporter. If the opposite were the case, the standard curve would have a negative slope.
Figure 7
Figure 7
Comparison of spectra of different light. Match the λex of your dyes to a wavelength that is provided strongly by the available illumination source(s). Images used by permission from zeiss.com. Hg: mercury; Xe: xenon; MH: metal halide.

References

    1. Adams DS. A new tool for tissue engineers: Ions as regulators of morphogenesis during development and regeneration. Tissue Engineering Part A. 2008;14(9):1461–1468. - PubMed
    1. Adams DS, Levin M. Measuring resting membrane potential using the fluorescent voltage reporters DiBAC4(3) and CC2-DMPE. Cold Spring Harb Protoc. 2012 - PMC - PubMed
    1. Beane WS, Morokuma J, Adams DS, Levin M. A chemical genetics approach reveals H,K-ATPase-mediated membrane voltage is required for planarian head regeneration. Chem Biol. 2011;18(1):77–89. - PMC - PubMed
    1. Blackiston D, Adams DS, Lemire JM, Lobikin M, Levin M. Transmembrane potential of GlyCl-expressing instructor cells induces a neoplastic-like conversion of melanocytes via a serotonergic pathway. Disease Models & Mechanisms. 2011;4(1):67–85. - PMC - PubMed
    1. Blackiston DJ, McLaughlin KA, Levin M. Bioelectric controls of cell proliferation: ion channels, membrane voltage and the cell cycle. Cell cycle (Georgetown, Tex) 2009;8(21):3519–3528. - PMC - PubMed

Publication types

LinkOut - more resources