

Physiologic responses to severe hemorrhagic shock and the genesis of cardiovascular collapse: can irreversibility be anticipated?
- PMID: 22475354
- PMCID: PMC3424406
- DOI: 10.1016/j.jss.2011.12.015
Physiologic responses to severe hemorrhagic shock and the genesis of cardiovascular collapse: can irreversibility be anticipated?
Abstract
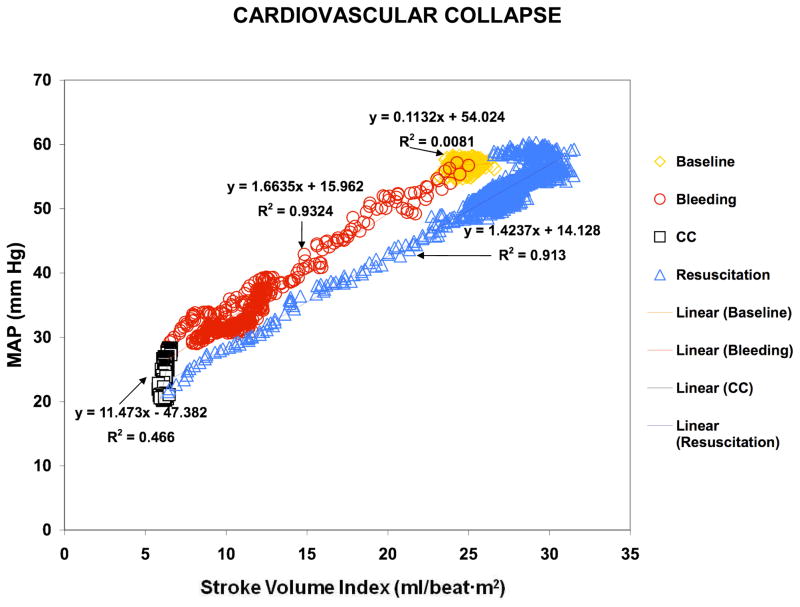
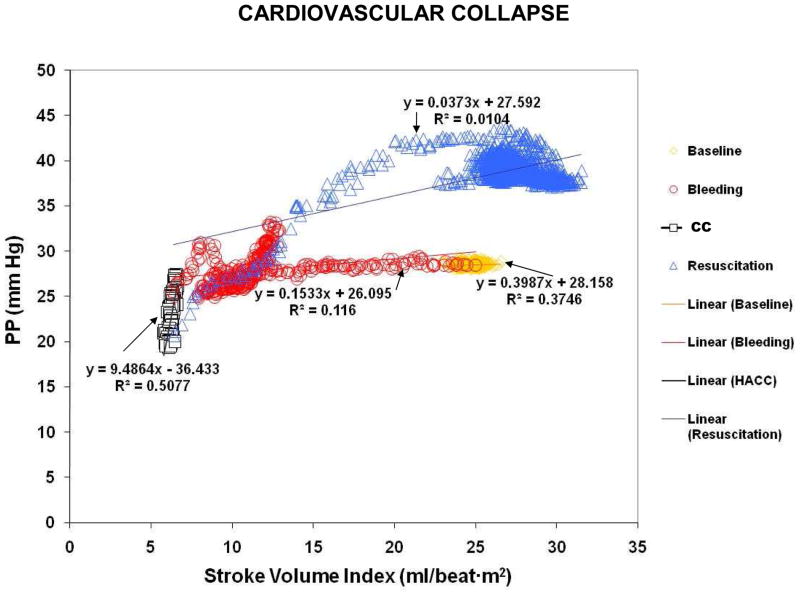
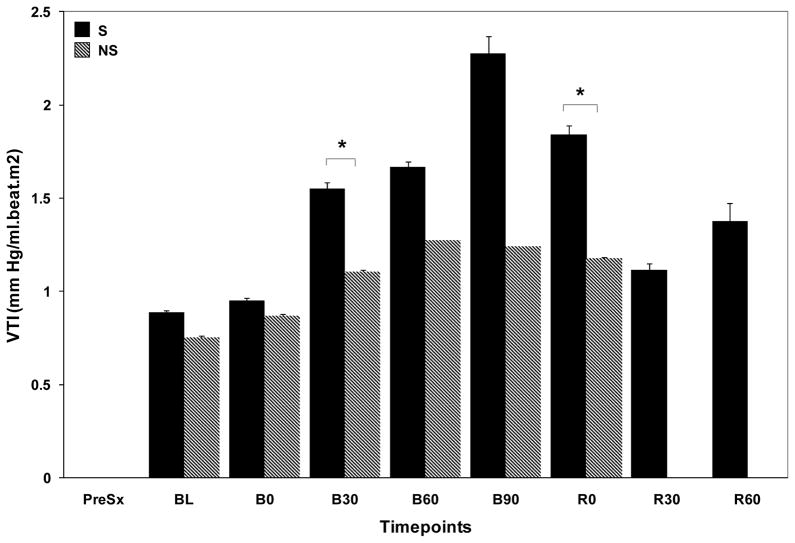
Background: The causes of cardiovascular collapse (CC) during hemorrhagic shock (HS) are unknown. We hypothesized that vascular tone loss characterizes CC, and that arterial pulse pressure/stroke volume index ratio or vascular tone index (VTI) would identify CC.
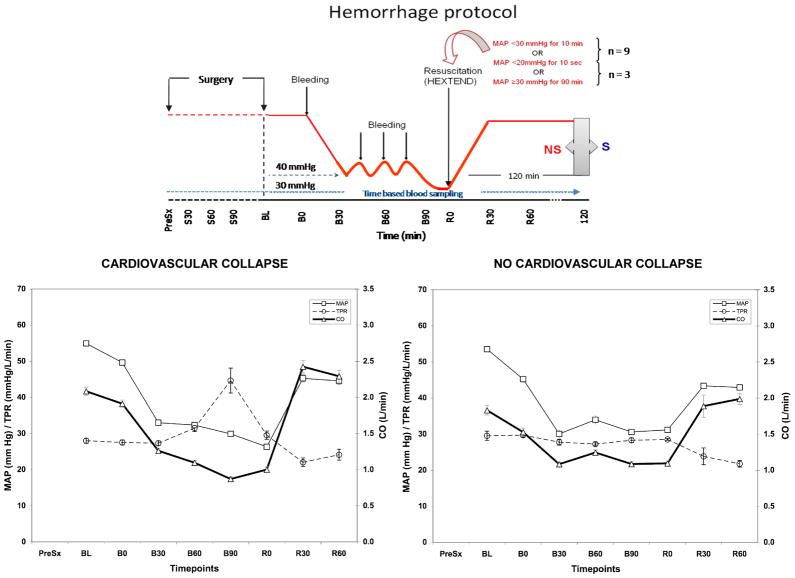
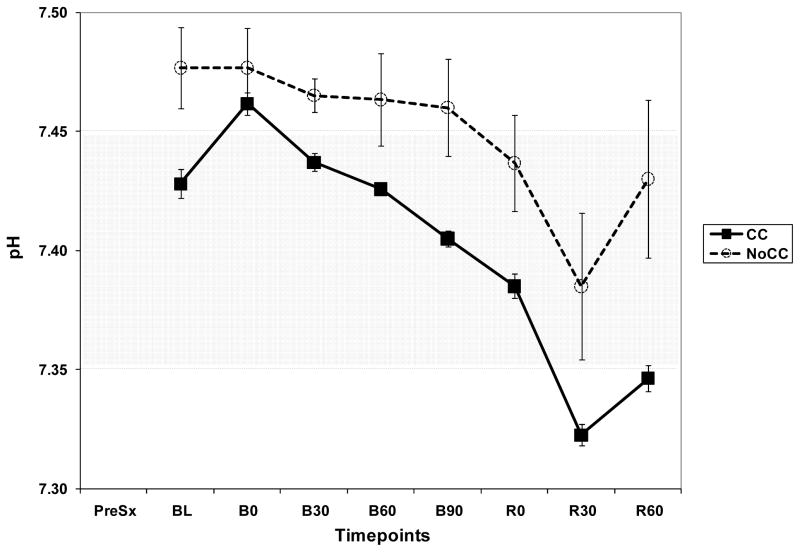
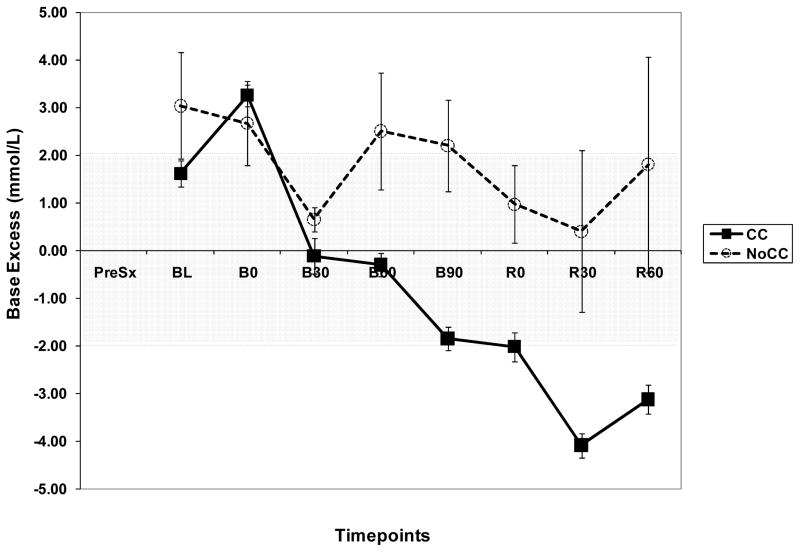
Methods: Fourteen Yorkshire-Durock pigs were bled to 30 mmHg mean arterial pressure and held there by repetitive bleeding until rendered unable to compensate (CC) or for 90 min (NoCC). They were then resuscitated in equal parts to shed volume and observed for 2 h. CC was defined as a MAP < 30 mmHg for 10 min or <20 mmHg for 10 s. Study variables were recorded at baseline (B0), 30, 60, 90 min after bleeding and at resuscitation (R0), 30, and 60 min afterward.
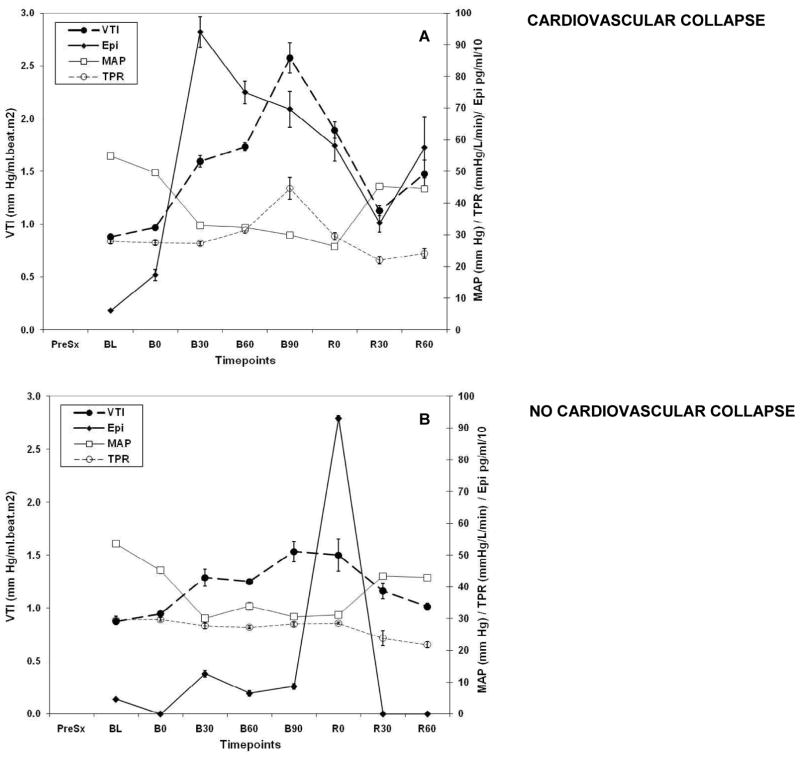
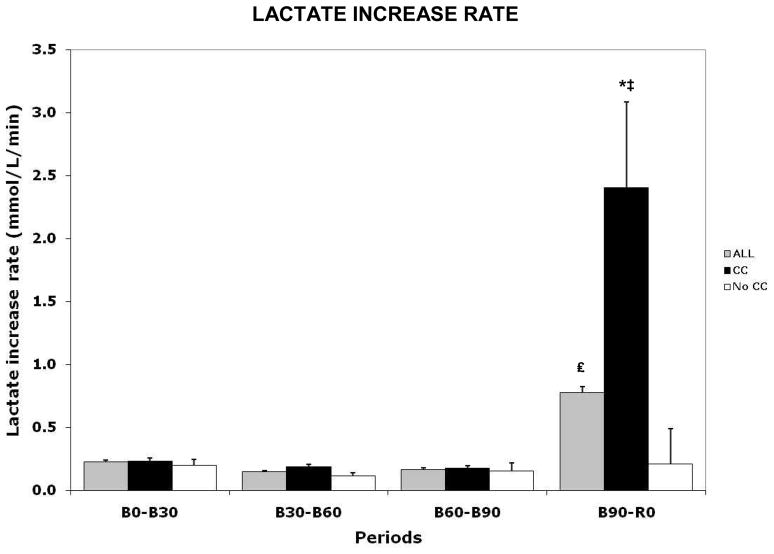
Results: Swine were bled to 32% ± 9% of total blood volume. Epinephrine (Epi) and VTI were low and did not change in NoCC after bleeding compared with CC swine, in which both increased (0.97 ± 0.22 to 2.57 ± 1.42 mcg/dL, and 173 ± 181 to 939 ± 474 mmHg/mL, respectively), despite no differences in bled volume. Lactate increase rate (LIR) increased with hemorrhage and was higher at R0 for CC, but did not vary in NoCC. VTI identified CC from NoCC and survivors from non-survivors before CC. A large increase in LIR was coincident with VTI decrement before CC occurred.
Conclusions: Vasodilatation immediately prior to CC in severe HS occurs at the same time as an increase in LIR, suggesting loss of tone as the mechanism causing CC, and energy failure as its probable cause.
Copyright © 2012 Elsevier Inc. All rights reserved.
Figures
Comment in
-
Physiologic responses to severe hemorrhagic shock and the genesis of cardiovascular collapse: can irreversibility be anticipated?J Surg Res. 2013 May 1;181(1):74-5. doi: 10.1016/j.jss.2012.02.024. Epub 2012 Mar 30. J Surg Res. 2013. PMID: 22487391 No abstract available.
References
-
- Aboab J, Polito A, Orlikowski D, Sharshar T, Castel M, Annane D. Hydrocortisone effects on cardiovascular variability in septic shock: a spectral analysis approach. Crit Care Med. 2008;36:1481–1486. - PubMed
-
- Annane D. Corticosteroids for sepsis: controversial forever? J Crit Care. 2007;22:329–330. - PubMed
-
- Annane D. Glucocorticoids in the treatment of severe sepsis and septic shock. Curr Opin Crit Care. 2005;11:449–453. - PubMed
-
- Annane D, Briegel J, Sprung CL. Corticosteroid insufficiency in acutely ill patients. N Engl J Med. 2003;348:2157–2159. - PubMed
Publication types
MeSH terms
Substances
Grants and funding
LinkOut - more resources
Full Text Sources
Medical
