Review
. 2012 Jul;33(7):323-32.
doi: 10.1016/j.it.2012.02.010. Epub 2012 Apr 2.

A deep profiler's guide to cytometry

Affiliations
Review

A deep profiler's guide to cytometry

Sean C Bendall et al. Trends Immunol. 2012 Jul.

Abstract

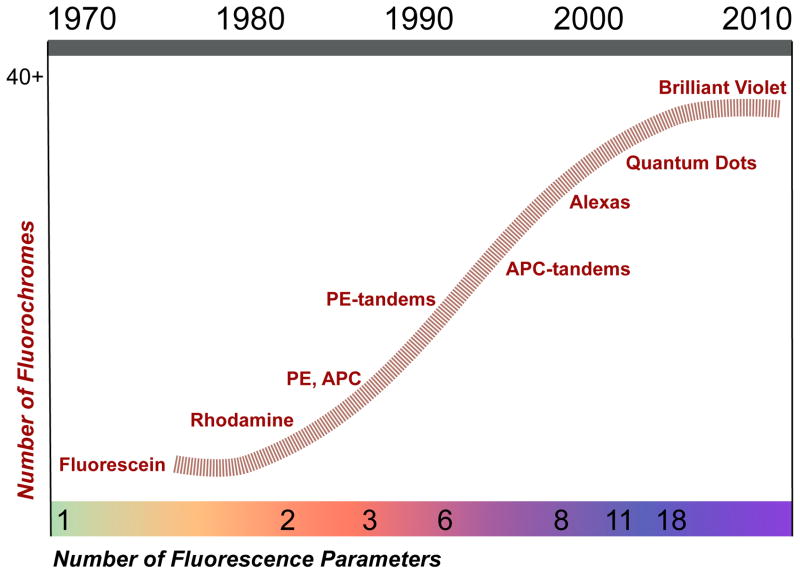
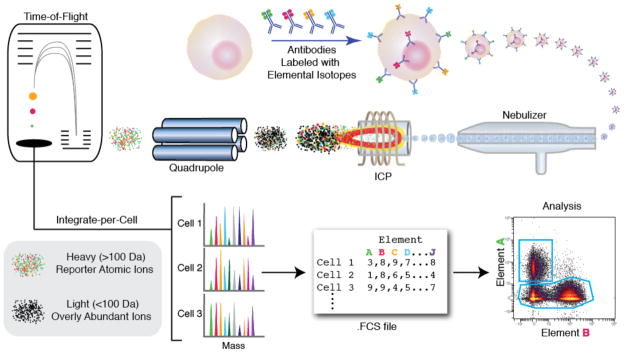
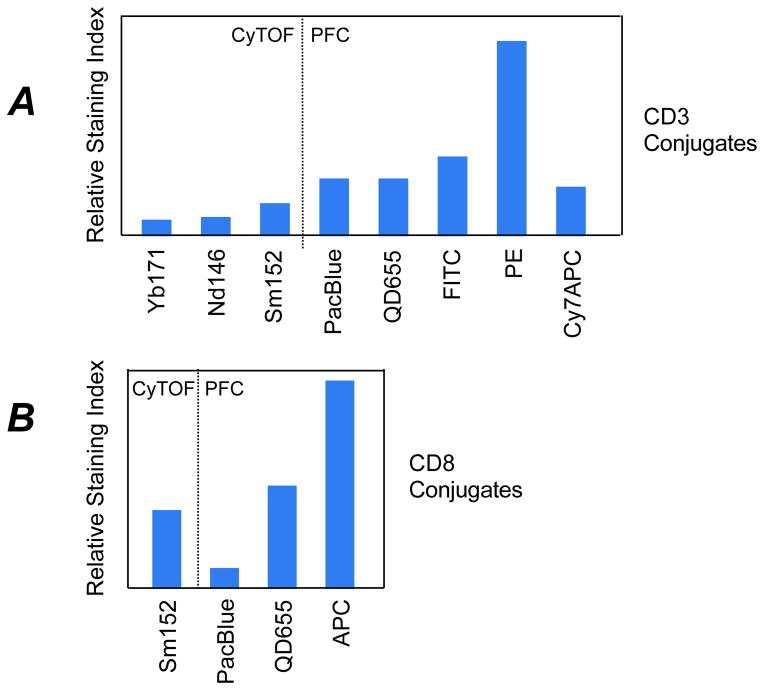
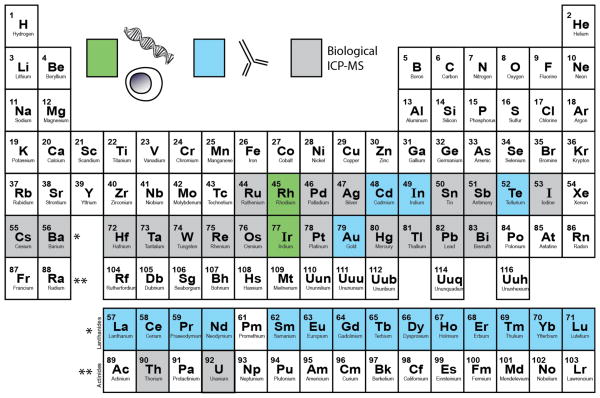
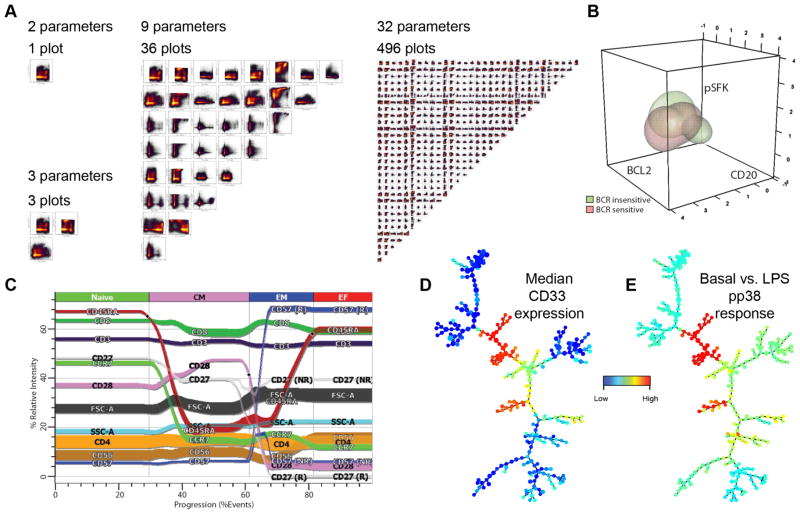
In recent years, advances in technology have provided us with tools to quantify the expression of multiple genes in individual cells. The ability to measure simultaneously multiple genes in the same cell is necessary to resolve the great diversity of cell subsets, as well as to define their function in the host. Fluorescence-based flow cytometry is the benchmark for this; with it, we can quantify 18 proteins per cell, at >10 000 cells/s. Mass cytometry is a new technology that promises to extend these capabilities significantly. Immunophenotyping by mass spectrometry provides the ability to measure >36 proteins at a rate of 1000 cells/s. We review these cytometric technologies, capable of high-content, high-throughput single-cell assays.


Conflict of interest statement

Conflict of Interest Disclosure. M.R. receives royalties on the sale of FlowJo software and Cy7APC fluorescent reagents. G.P.N. owns stock and is a paid consultant with DVS Sciences (CyTOF manufacturer) and is a paid consultant with Becton Dickenson, a purveyor of reagents central to both cytometry platforms.

Figures

Figure 1
Figure 1. History of Fluorochrome Development
A timeline showing when the major fluorochromes were introduced, and how this related to the maximum number parameters that could be simultaneously measured at that time.
Figure 2
Figure 2. Mass cytometry allows single-cell atomic mass spectrometry of heavy elemental (> 100 Da) reporters
Schematic of ICP-MS-based analysis of cellular markers. An affinity product (e.g., antibody) tagged with a specific element binds to the cellular epitope. The cell is introduced into the ICP by droplet nebulization. Each cell is atomized, ionized, overly abundant ions removed, and the elemental composition of remaining heavy elements (reporters) is determined. Signals corresponding to each elemental tag are then correlated with the presence of the respective marker and analyzed using conventional cytometry platforms.
Figure 3
Figure 3. Performance of various metal isotopes and fluorochromes
(a) Relative staining indices, calculated as described in [15], for a CD3 antibody conjugated to Yb171, Neodynium 146 (Nd146), or Samarium 152 (Sm152) and analyzed by CyTOF, or Pacific Blue (PacBlue), Quantum Dot 655 (QD655), FITC, PE, or Cy7APC and analyzed by PFC. Staining indices by CyTOF are low. (b) Relative staining indices for mouse anti-human CD8 (clone RPA-T8) conjugated to Sm152 and analyzed by CyTOF, and conjugated to PacBlue, QD655, or APC and analyzed by PFC. Staining indices for CD8 conjugates were considerably higher than anti-CD3 antibodies, and CyTOF conjugates had better performance than PacBlue (PFC) conjugate. Note, low staining indices may be acceptable for many applications, because background staining can be low by CyTOF.
Figure 4
Figure 4. Periodic table summarizing the feasible elemental reporters for single-cell mass cytometry measurement in a biological matrix
Colored elements (green, blue, grey) are those with at least one (relatively) stable isotope having an atomic mass greater than 100 daltons. Green elements have been demonstrated in estimating DNA content and cell size[33, 42], blue elements have been conjugated to antibodies for cell-based mass cytometry measurements using either a chelating polymer[37, 40] or semiconductor nanocrystals – Qdots[42], grey elements have not been published in mass cytometry studies yet but are readily analyzed by ICP-MS. These are future development targets.
Figure 5
Figure 5. Complexity of multidimensional single-cell analysis
(a) “Human interpretable” two-(D)imensional scatter plots are not a scalable solution in single-cell analysis. As the number of single cell parameters increases, the number of unique 2D plots increases exponentially. (b) FLAME analysis of B lymphocytes. Clustered cell events graphically displayed for visual comparison of receptor signaling cell populations. (c) Gemstone analysis of CD8 T cells showing progression of phenotypic markers including branching expression of markers like CD57 D–E) SPADE plots representing clusters of cells in normal human bone marrow. D) is the expression of CD33 (monocytes) across all cell clusters. (e) is the level of phosphor p38 (pp38) measured in response to LPS stimulation and normalized to an unstimulated (basal) control.

Similar articles

Cited by

References

    1. Van Dilla M, et al. Los Alamos Scientifi Laboratory Annual Report of the Biological and Medical Research Group. 1967. The fluorescent cell photometer: A new method for the rapid measurement of biological cells stained with fluorescent dyes.
    1. Hulett HR, et al. Development and application of a rapid cell sorter. Clin Chem. 1973;19:813–816. - PubMed
    1. Kamentsky LA. Future directions for flow cytometry. J Histochem Cytochem. 1979;27:1649–1654. - PubMed
    1. Steinkamp JA, et al. Dual-laser flow cytometry of single mammalian cells. J Histochem Cytochem. 1979;27:273–276. - PubMed
    1. Shapiro HM, et al. Immunofluorescence measurement in a flow cytometer using low-power helium-neon laser excitation. Cytometry. 1983;4:276–279. - PubMed

Publication types