. 2012 Jun;13(3):403-21.
doi: 10.1007/s10162-012-0319-2. Epub 2012 Apr 3.

Maturation and aging of the human cochlea: a view through the DPOAE looking glass

Affiliations

Maturation and aging of the human cochlea: a view through the DPOAE looking glass

Carolina Abdala et al. J Assoc Res Otolaryngol. 2012 Jun.

Abstract

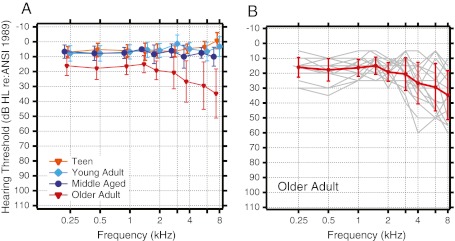
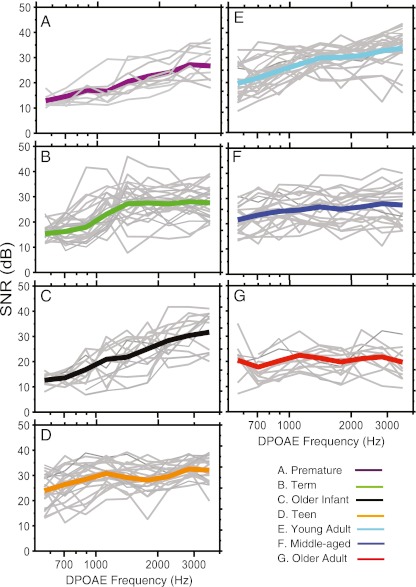
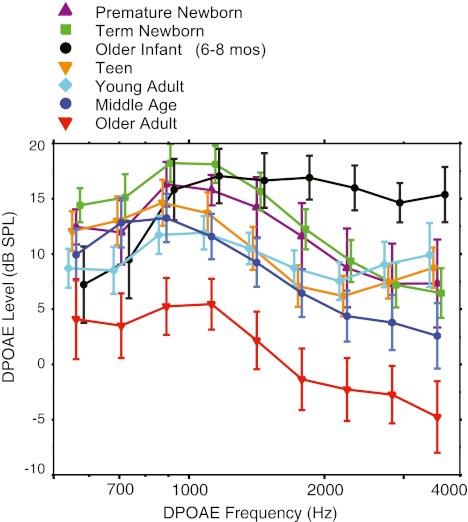
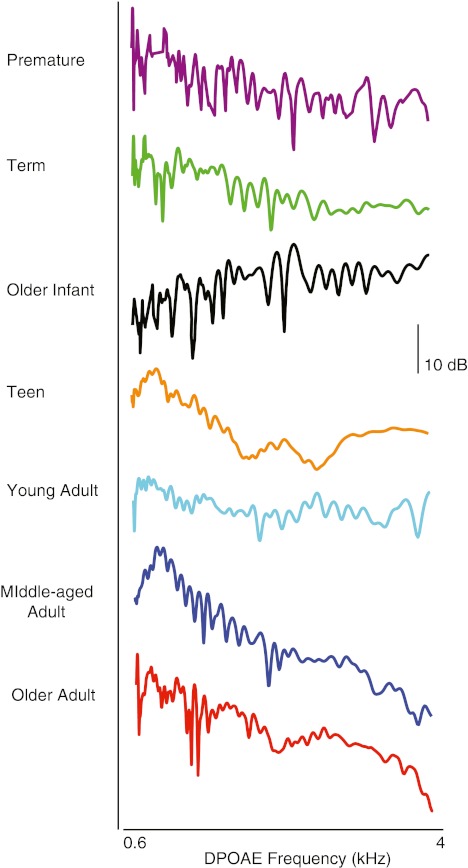
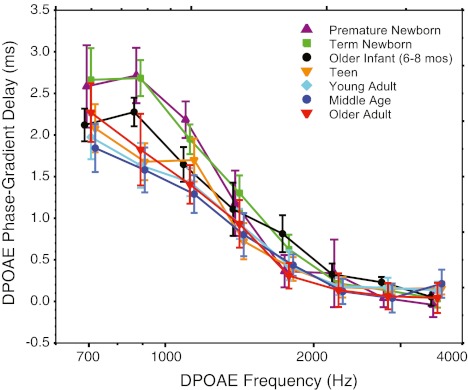
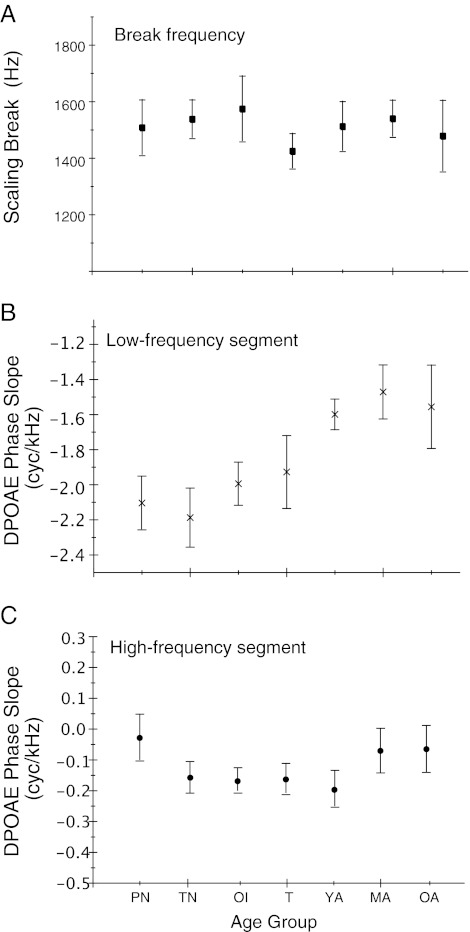
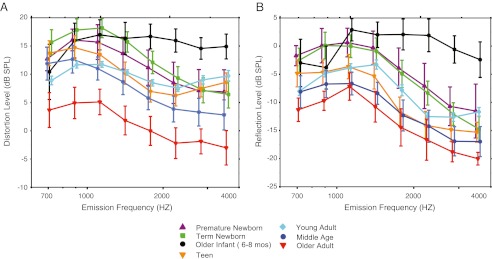
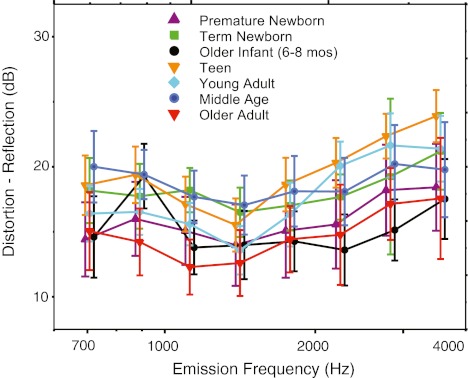
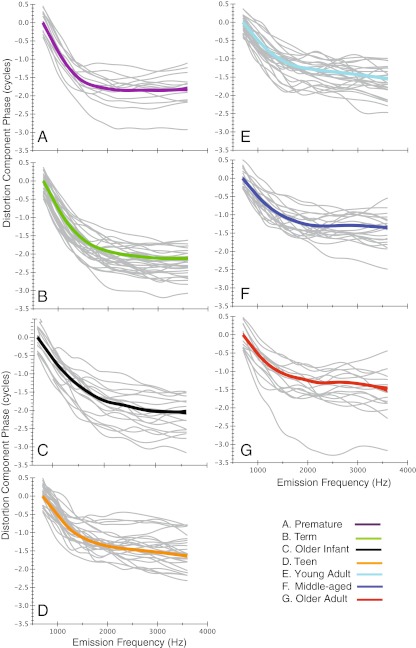
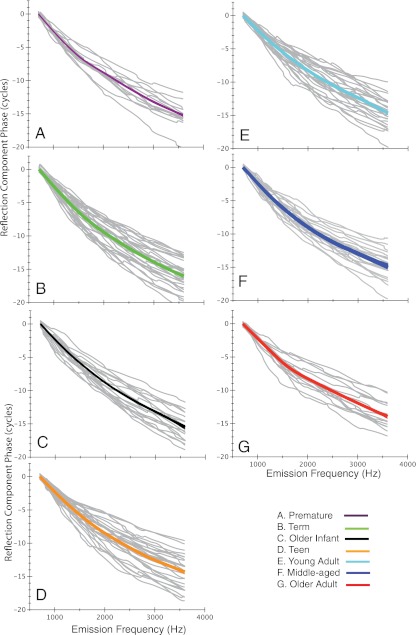
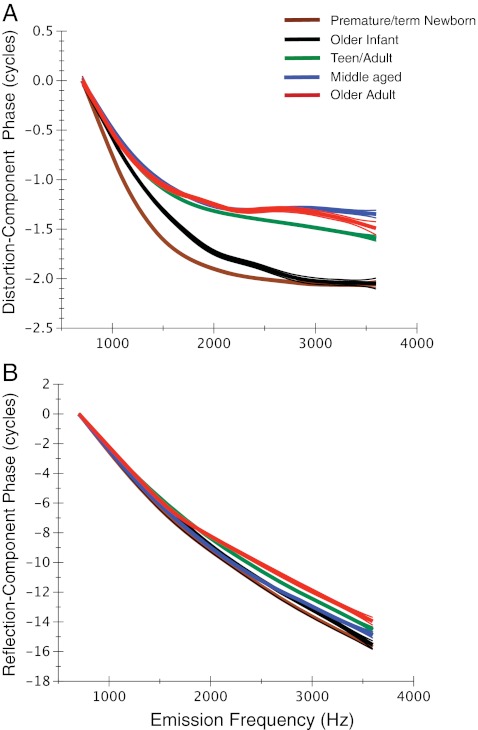
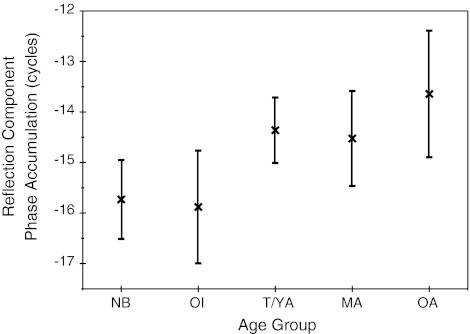
Cochlear function changes throughout the human lifespan. Distortion product otoacoustic emissions (DPOAEs) were recorded in 156 ears to examine these changes and speculate as to their mechanistic underpinnings. DPOAEs were analyzed within the context of current OAE generation theory, which recognizes distinct emission mechanisms. Seven age groups including premature newborns through senescent adults were tested with a swept-tone DPOAE protocol to examine magnitude and phase features of both the mixed DPOAE and individual distortion and reflection components. Results indicate (1) 6-8-month-old infants have the most robust DPOAE and component levels for frequencies >1.5 kHz; (2) older adults show a substantial reduction in DPOAE and distortion-component levels combined with a smaller drop in reflection-component levels; (3) all age groups manifest a violation of distortion phase invariance at frequencies below 1.5 kHz consistent with a secular break in cochlear scaling; the apical phase delay is markedly longer in newborns; and (4) phase slope of reflection emissions is most shallow in the older adults. Combined findings suggest that basilar membrane motion in the apical half of the cochlea is immature at birth and that the cochlea of senescent adults shows reduced nonlinearity and relatively shallow reflection-component phase slope, which can be interpreted to suggest degraded tuning.


Figures

FIG. 1.
FIG. 1.
A Mean audiometric thresholds for teen, young adult, middle aged, and older adult age groups. Error bars represent ±1 standard deviation of the mean and are offset for visualization purposes. B Individual audiometric thresholds (gray) for older adults with mean superimposed.
FIG. 2
FIG. 2
DPOAE signal-to-noise ratio (SNR) across frequency for individual subjects in each age group (gray lines) with the mean SNR superimposed; age group is denoted by color and by panel label, AG.
FIG. 3
FIG. 3
Mean DPOAE levels averaged into third-octave bins for seven age groups. Age is denoted by color and symbol. Error bars represent 95 % CIs and are offset for easy visualization.
FIG. 4
FIG. 4
DPOAE level fine structure from one representative subject for each of seven age groups. DPOAE level was measured at between 400 and 550 frequencies across the three-octave frequency range in frequency intervals ranging from 9 to 12 Hz.
FIG. 5
FIG. 5
Mean DPOAE phase-gradient delay averaged into third-octave bins for seven age groups. Age is denoted by color and symbol. Error bars represent 95 % CIs and are offset for easy visualization.
FIG. 6
FIG. 6
Three features were derived from a spline model fit to individual DPOAE phase-frequency functions from all subjects: (A) mean “break” frequency denoting where DPOAE phase delay deviates from invariance, (B) mean phase slope of the low-frequency segment (below the break frequency), and (C) mean phase slope of the high-frequency segment (above break frequency). Age groups: PN, TN = premature and term newborn, respectively; OI = older infant; T = teen; YA = young adult; MA = middle-aged adult; and OA = older adult. Error bars represent 95 % CIs.
FIG. 7
FIG. 7
IFFT-derived (A) distortion- and (B) reflection-component levels averaged into third-octave bins for seven age groups. Age is denoted by color and symbol. Error bars represent 95 % CIs and are offset for easy visualization.
FIG. 8
FIG. 8
Mean difference between distortion- and reflection-component levels averaged into third-octave bins for seven age groups. Age is denoted by color and symbol. Error bars represent 95 % CIs and are offset for easy visualization.
FIG. 9
FIG. 9
Loess trend lines (thick colored line) superimposed on individual distortion component phase-frequency functions (gray lines). Ninety-five percent CIs for model prediction are displayed as thin lines around each trend line. Age group is denoted by color of the loess line and by panel label, AG. Starting phase has been normalized to zero.
FIG. 10
FIG. 10
Loess trend lines (thick colored line) superimposed on individual reflection component phase-frequency functions (gray lines). Ninety-five percent CIs for model prediction are displayed as thin lines around each trend line. Age group is denoted by color of the loess line and by panel label, AG. Starting phase has been normalized to zero.
FIG. 11
FIG. 11
The loess trend lines fit to age group phase-frequency functions are shown here superimposed for (A) distortion and (B) reflection components separately. Age is denoted by color. Note that newborns (premature and term) were combined into one age group as were teens and young adults for this display. Ninety-five percent CIs for model prediction are displayed as thin lines around each trend line. Starting phase has been normalized to zero.
FIG. 12
FIG. 12
Mean reflection-component phase accumulation calculated between 0.7 and 3.6 kHz for seven age groups: NB = premature and term newborns combined, OI = older infants (6–8 months), T/YA = combined teen and young adults, MA = middle-aged adults, OA = older adults. Error bars represent 95 % CIs.

References

    1. Abdala C. Distortion product otoacoustic emission (2f1–f2) amplitude as a function of f2/f1 frequency ratio and primary tone level separation in human adults and neonates. J Acoust Soc Am. 1996;100:3726–3740. doi: 10.1121/1.417234. - DOI - PubMed
    1. Abdala C. A developmental study of distortion product otoacoustic emission (2f1–f2) suppression in humans. Hear Res. 1998;121:125–138. doi: 10.1016/S0378-5955(98)00073-2. - DOI - PubMed
    1. Abdala C. Distortion product otoacoustic emission (2f1–f2) amplitude growth in human adults and neonates. J Acoust Soc Am. 2000;107:446–456. doi: 10.1121/1.428315. - DOI - PubMed
    1. Abdala C, Dhar S. DPOAE phase and component analysis in human newborns. J Acoust Soc Am. 2010;127:316–325. doi: 10.1121/1.3268611. - DOI - PMC - PubMed
    1. Abdala C, Keefe D. Effects of middle-ear immaturity on DPOAE suppression tuning in infant ears. J Acoust Soc Am. 2006;120:3832–3842. doi: 10.1121/1.2359237. - DOI - PubMed

Publication types