. 2012 Jun 15;205(12):1778-87.
doi: 10.1093/infdis/jis101. Epub 2012 Apr 3.

HIV infection and antiretroviral therapy have divergent effects on mitochondria in adipose tissue

Affiliations

HIV infection and antiretroviral therapy have divergent effects on mitochondria in adipose tissue

Caryn G Morse et al. J Infect Dis. .

Abstract

Background: Although human immunodeficiency virus (HIV) infection and antiretroviral therapy (ART) affect mitochondrial DNA (mtDNA) content and function, comprehensive evaluations of their effects on mitochondria in muscle, adipose tissue, and blood cells are limited.

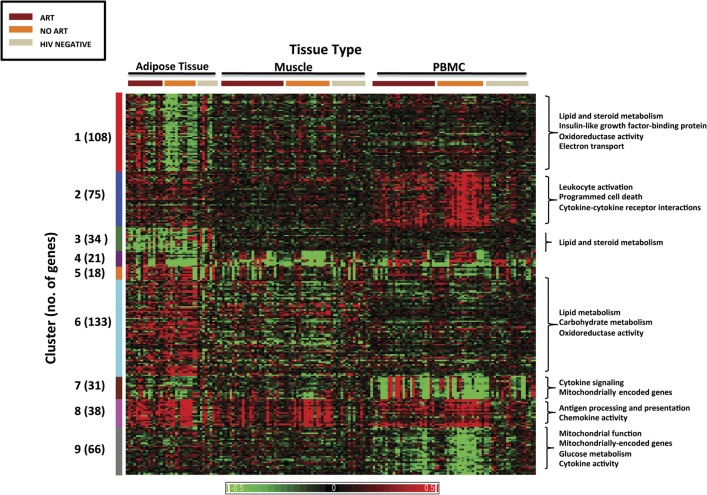
Methods: Mitochondrial DNA quantification, mitochondrial genome sequencing, and gene expression analysis were performed on muscle, adipose tissue, and peripheral blood mononuclear cell (PBMC) samples from untreated HIV-positive patients, HIV-positive patients receiving nucleoside reverse transcriptase inhibitor (NRTI)-based ART, and HIV-negative controls.

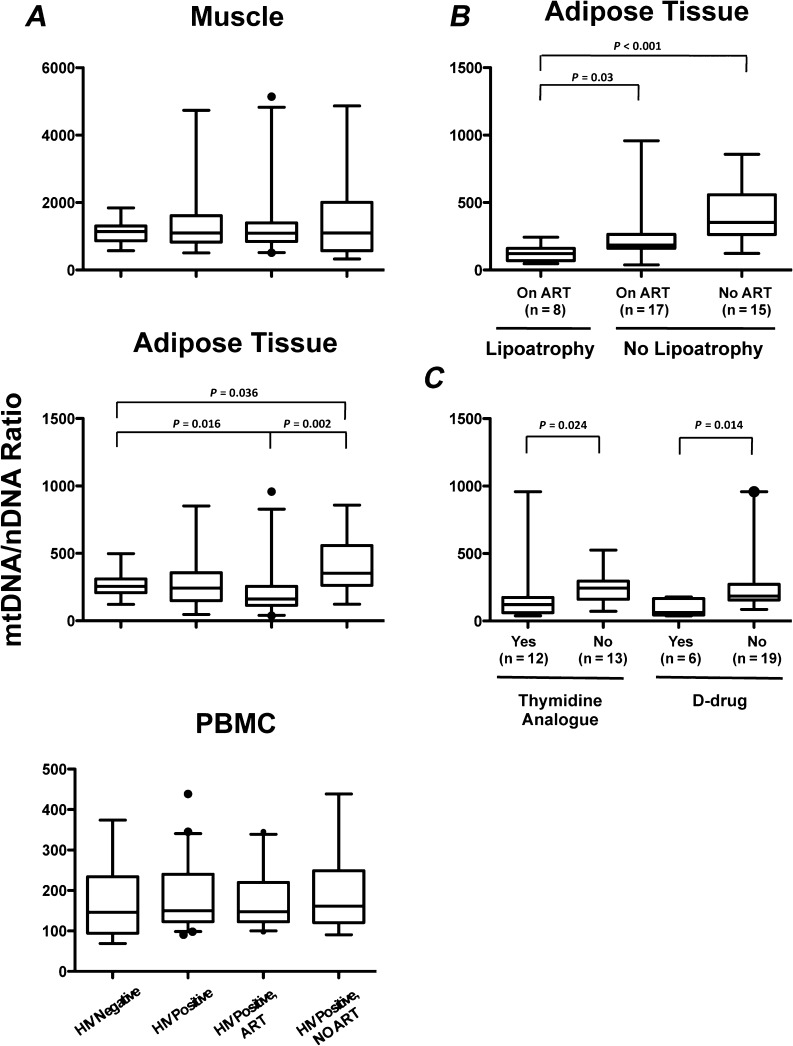
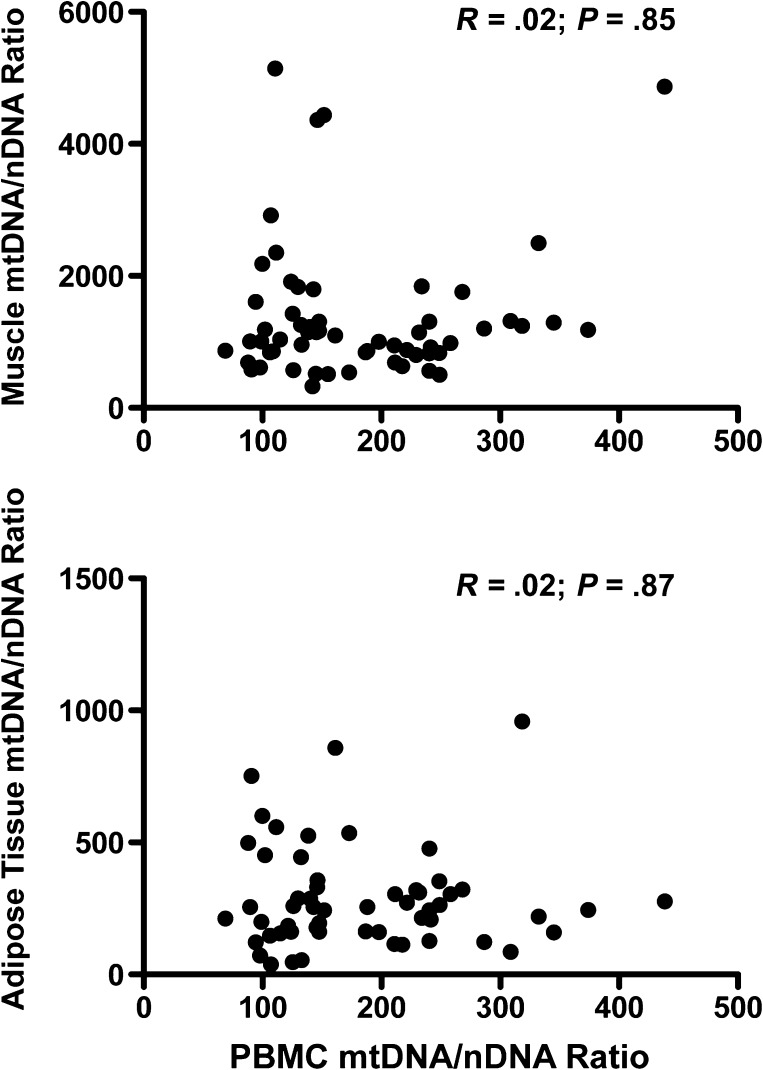
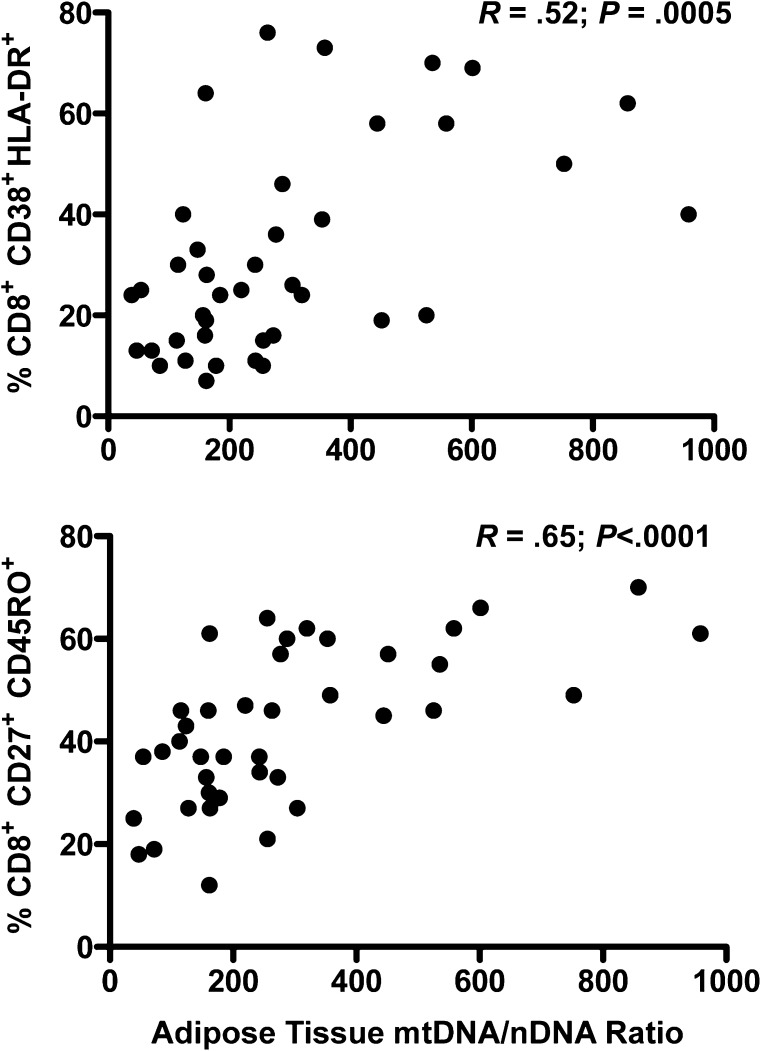
Results: The adipose tissue mtDNA/nuclear DNA (nDNA) ratio was increased in untreated HIV-infected patients (ratio, 353) and decreased in those receiving ART (ratio, 162) compared with controls (ratio, 255; P < .05 for both comparisons); the difference between the 2 HIV-infected groups was also significant (P = .002). In HIV-infected participants, mtDNA/nDNA in adipose tissue correlated with the level of activation (CD38+ /HLA-DR+) for CD4+ and CD8+ lymphocytes. No significant differences in mtDNA content were noted in muscle or PMBCs among groups. Exploratory DNA microarray analysis identified differential gene expression between patient groups, including a subset of adipose tissue genes.

Conclusions: HIV infection and ART have opposing effects on mtDNA content in adipose tissue; immune activation may mediate the effects of HIV, whereas NRTIs likely mediate the effects of ART.


Figures

Figure 1.
Figure 1.
Mitochondrial DNA (mtDNA) to nuclear DNA (nDNA) ratio in muscle, adipose tissue, and peripheral blood mononuclear cells (PBMCs) by patient group. A, mtDNA/nDNA in adipose tissue is significantly higher in patients infected with human immunodeficiency virus (HIV) not on therapy and significantly lower in patients receiving antiretroviral therapy (ART) compared with HIV-negative controls, whereas muscle and PBMC mtDNA/nDNA were not different among the groups. PBMC and tissue samples available for analysis for all HIV-negative participants (n = 15). PBMCs were available for all HIV-positive participants (n = 46). Muscle samples were available for 45 HIV-positive participants (28 on ART, 17 no ART). Adipose tissue samples were available for 40 HIV-positive participants (25 on ART, 15 no ART). B, mtDNA/nDNA in adipose tissue is decreased in patients with clinical lipodystrophy. C, mtDNA/nDNA is decreased in the adipose tissue of HIV-infected patients receiving thymidine analogues (zidovudine or stavudine) and/or D-drugs (didanosine or stavudine). Individuals receiving stavudine were included in both the thymidine analogue and D-drug groups. Box plots indicate median, interquartile range (box) and the 5%–95% range (whiskers). Outliers indicated by solid circles. Comparisons between groups are nonsignificant except where indicated.
Figure 2.
Figure 2.
Relationship between mitochondrial DNA (mtDNA) to nuclear DNA (mtDNA/nDNA) in peripheral blood mononuclear cells (PBMCs) and tissues. There is no correlation between mtDNA/nDNA in PBMCs and mtDNA content in muscle (top) or adipose tissue (bottom). Each dot represents results for a single individual. Nonparametric correlation coefficients (Spearman) and P values are shown within the graphs.
Figure 3.
Figure 3.
Relationship between adipose tissue mitochondrial DNA (mtDNA) to nuclear DNA (mtDNA/nDNA) and selected CD8+ T-lymphocyte subsets in patients infected with human immunodeficiency virus (HIV). A strong correlation was seen between adipose tissue mtDNA/nDNA and the percentage of total CD8+ cells that were activated (HLA-DR+/CD38+, top) or had a central memory phenotype (CD27+/CD45RO+, bottom). Nonparametric correlation coefficients (Spearman) and P values are shown within the graphs. A significant correlation was also seen between adipose tissue mtDNA/nDNA and the percentage of total CD4+ cells that were activated (HLA-DR+/CD38+; R = 0.44, P = .005; data not shown).
Figure 4.
Figure 4.
Histopathologic abnormalities noted on muscle biopsy of patients infected with human immunodeficiency virus (HIV) included (A) ragged red fibers (arrow, Gomori trichrome stain; red indicates mitochondrial proliferation), (B) inflammatory infiltrate (arrow, hematoxylin-eosin stain), and (C) cytochrome oxidase (COX) negative fibers (arrows, cytochrome oxidase stain, brown indicates cytochrome oxidase activity).
Figure 5.
Figure 5.
Heat map of gene expression profile by a custom microarray. The findings for all 3 tissue types—fat, muscle, and peripheral blood mononuclear cells (PBMCs)—are shown. Each column represents an individual patient sample, and each row represents an individual gene. Differences in relative levels of gene expression (z score) are represented in color, where red indicates upregulation and green indicates downregulation relative to that of corresponding median gene expression in HIV-negative controls. The hierarchical analyses classified the genes into 9 distinct clusters based on differential expression pattern between the groups, indicated on the left. The numbers in parenthesis indicate the number of genes in each cluster. Functional annotation analysis identified biologically relevant pathways by cluster, indicated on the right for selected clusters.

Comment in

References

    1. Panel on Antiretroviral Guidelines for Adults and Adolescents. Guidelines for the use of antiretroviral agents in HIV-1-infected adults and adolescents. Department of Health and Human Services; 2011. pp. 1–166. http://www.aidsinfo.nih.gov/ContentFiles/AdultandAdolescentGL.pdf. Accessed 13 January 2011.
    1. Chen CH, Cheng YC. Delayed cytotoxicity and selective loss of mitochondrial DNA in cells treated with the anti-human immunodeficiency virus compound 2′,3′-dideoxycytidine. J Biol Chem. 1989;264:11934–7. - PubMed
    1. Chen CH, Vazquez-Padua M, Cheng YC. Effect of anti-human immunodeficiency virus nucleoside analogs on mitochondrial DNA and its implication for delayed toxicity. Mol Pharmacol. 1991;39:625–8. - PubMed
    1. Brinkman K, ter Hofstede HJ, Burger DM, Smeitink JA, Koopmans PP. Adverse effects of reverse transcriptase inhibitors: mitochondrial toxicity as common pathway. AIDS. 1998;12:1735–44. - PubMed
    1. Lewis W, Dalakas MC. Mitochondrial toxicity of antiviral drugs. Nat Med. 1995;1:417–22. - PubMed

Publication types