. 2012 Aug;64(2):499-508.
doi: 10.1007/s00248-012-0043-9. Epub 2012 Apr 5.

Quality-score refinement of SSU rRNA gene pyrosequencing differs across gene region for environmental samples

Affiliations

Quality-score refinement of SSU rRNA gene pyrosequencing differs across gene region for environmental samples

Kara Bowen De León et al. Microb Ecol. 2012 Aug.

Abstract

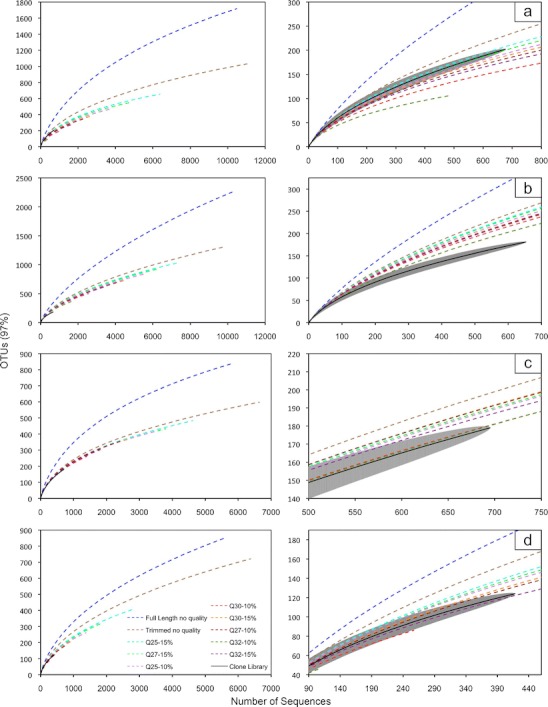
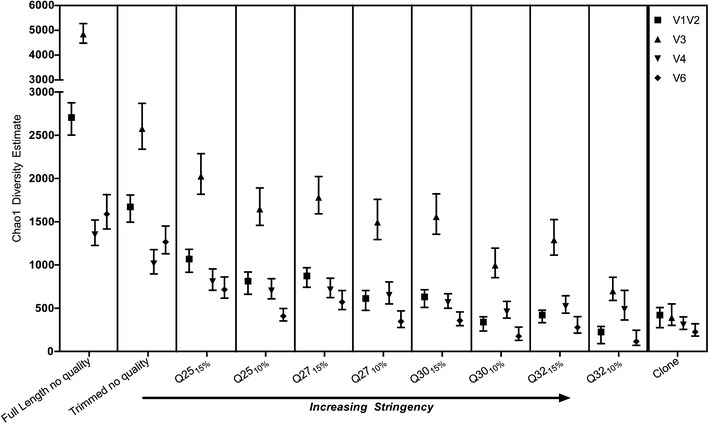
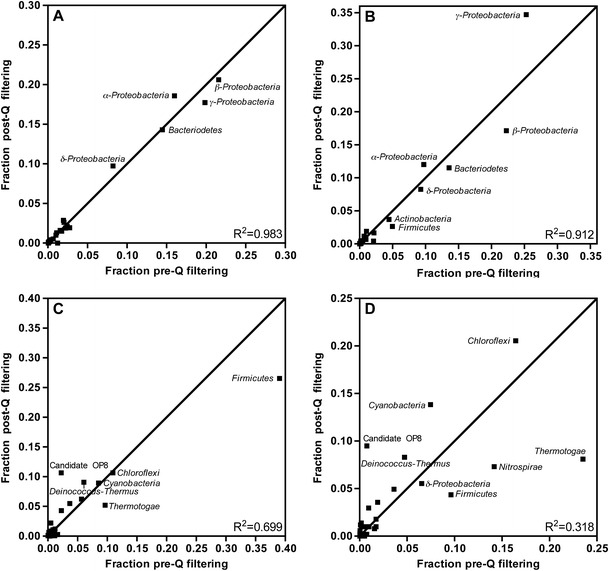
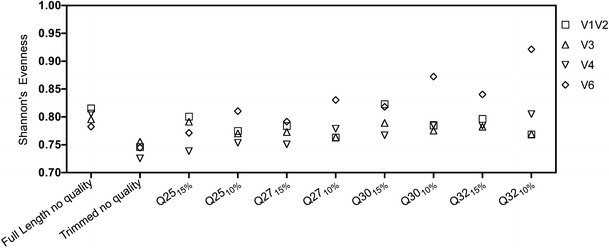
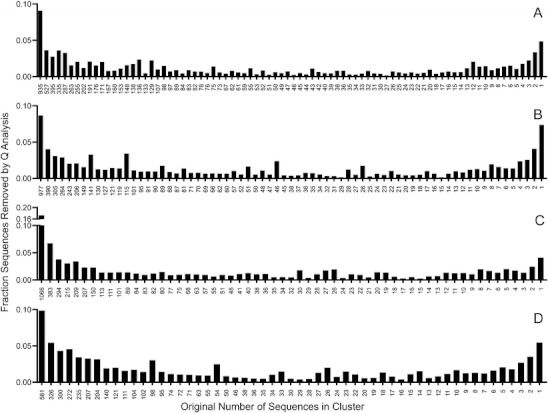
Due to potential sequencing errors in pyrosequencing data, species richness and diversity indices of microbial systems can be miscalculated. The "traditional" sequence refinement method is not sufficient to account for overestimations (e.g., length, primer errors, ambiguous nucleotides). Recent in silico and single-organism studies have revealed the importance of sequence quality scores in the estimation of ecological indices; however, this is the first study to compare quality-score stringencies across four regions of the SSU rRNA gene sequence (V1V2, V3, V4, and V6) with actual environmental samples compared directly to corresponding clone libraries produced from the same primer sets. The nucleic acid sequences determined via pyrosequencing were subjected to varying quality-score cutoffs that ranged from 25 to 32, and at each quality-score cutoff, either 10 or 15 % of the nucleotides were allowed to be below the cutoff. When species richness estimates were compared for the tested samples, the cutoff values of Q27(15%), Q30(10%), and Q32(15%) for V1V2, V4, and V6, respectively, estimated similar values as obtained with clone libraries and Sanger sequencing. The most stringent Q tested (Q32(10%)) was not enough to account for species richness inflation of the V3 region pyrosequence data. Results indicated that quality-score assessment greatly improved estimates of ecological indices for environmental samples (species richness and α-diversity) and that the effect of quality-score filtering was region-dependent.


Figures

Figure 1
Figure 1
Species richness estimates for the V1V2 (a), V3 (b), V4 (c), and V6 (d) SSU rRNA gene regions. Full and enlarged rarefaction curves are displayed for each region of the SSU rRNA gene. Operational taxonomic units (OTUs) are clustered at 97 % similarity. The wide gray line in the enlarged rarefaction curves represents 95 % confidence intervals for the clone library species richness predictions
Figure 2
Figure 2
Chao1 diversity estimates for the same samples at different Q filtering compared to the respective clonal library. Error bars denote 95 % confidence intervals
Figure 3
Figure 3
Phylogenetic comparison pre- and post-quality filtering. The phylum (class for Proteobacteria) distribution was compared for each region of the SSU rRNA gene at the Q suggested by the rarefaction curves in Fig. 1 (Q2715% for V1V2 (a), Q3210% for V3 (b), Q3010% for V4 (c), and Q3215% for V6 (d)). The coordinates for each taxon correspond to the abundance by fraction of unfiltered sequences (x-axis) and fraction of filtered high-quality sequences (y-axis). The scale differs across graphs to maximize point separation. Taxa along the line of y = x did not show a shift in percent abundance during filtering while those left and above the line represent phylogenetic groups that shifted to higher abundance post-filtering, and those right and below the line had a lower abundance post-filtering. Linear regression analysis to the line y = x yielded R 2 values that indicate how well each region fits the assumption that the sequences removed were not phylogenetically biased
Figure 4
Figure 4
Shannon's evenness for each respective library with increasing stringency of Q filtering
Figure 5
Figure 5
Fraction of total sequences removed from clusters which have been trimmed but not quality filtered during Q analysis. Sequences were clustered pre-quality checking, and the cluster in which sequences were removed during quality checking was monitored for the V1V2 (a), V3 (b), V4 (c), and V6 (d) SSU rRNA gene regions. The Q parameter was Q2715% for V1V2, Q3210% for V3, Q3010% for V4, and Q3215% for V6. The majority of sequences were removed from the largest and smallest clusters

References

    1. Margulies M, Egholm M, Altman WE, Attiya S, Bader JS, Bemben LA, Berka J, Braverman MS, Chen YJ, Chen ZT, Dewell SB, Du L, Fierro JM, Gomes XV, Godwin BC, He W, Helgesen S, Ho CH, Irzyk GP, Jando SC, Alenquer MLI, Jarvie TP, Jirage KB, Kim JB, Knight JR, Lanza JR, Leamon JH, Lefkowitz SM, Lei M, Li J, Lohman KL, Lu H, Makhijani VB, McDade KE, McKenna MP, Myers EW, Nickerson E, Nobile JR, Plant R, Puc BP, Ronan MT, Roth GT, Sarkis GJ, Simons JF, Simpson JW, Srinivasan M, Tartaro KR, Tomasz A, Vogt KA, Volkmer GA, Wang SH, Wang Y, Weiner MP, Yu PG, Begley RF, Rothberg JM. Genome sequencing in microfabricated high-density picolitre reactors. Nature. 2005;437:376–380. - PMC - PubMed
    1. Sogin ML, Morrison HG, Huber JA, Welch DM, Huse SM, Neal PR, Arrieta JM, Herndl GJ. Microbial diversity in the deep sea and the underexplored “rare biosphere”. Proc Natl Acad Sci USA. 2006;103:12115–12120. doi: 10.1073/pnas.0605127103. - DOI - PMC - PubMed
    1. Kunin V, Engelbrektson A, Ochman H, Hugenholtz P. Wrinkles in the rare biosphere: pyrosequencing errors can lead to artificial inflation of diversity estimates. Environ Microbiol. 2010;12:118–123. doi: 10.1111/j.1462-2920.2009.02051.x. - DOI - PubMed
    1. Quince C, Lanzén A, Curtis TP, Davenport RJ, Hall N, Head IM, Read LF, Sloan WT. Accurate determination of microbial diversity from 454 pyrosequencing data. Nat Methods. 2009;6:639–641. doi: 10.1038/nmeth.1361. - DOI - PubMed
    1. Huse SM, Welch DM, Morrison HG, Sogin ML. Ironing out the wrinkles in the rare biosphere through improved OTU clustering. Environ Microbiol. 2010;12:1889–1898. doi: 10.1111/j.1462-2920.2010.02193.x. - DOI - PMC - PubMed

Publication types

Substances

LinkOut - more resources