. 2012 Jun;3(2):117-37.
doi: 10.1007/s13539-011-0047-1. Epub 2011 Nov 30.

The effect of exercise on IL-6-induced cachexia in the Apc ( Min/+) mouse

Affiliations

The effect of exercise on IL-6-induced cachexia in the Apc ( Min/+) mouse

Melissa J Puppa et al. J Cachexia Sarcopenia Muscle. 2012 Jun.

Abstract

Background: Cachexia involves unintentional body weight loss including diminished muscle and adipose tissue mass and is associated with an underlying disease. Systemic overexpression of IL-6 accelerates cachexia in the Apc(Min/+) mouse, but does not induce wasting in control C57BL/6 mice. With many chronic diseases, chronic inflammation and metabolic dysfunction can be improved with moderate exercise. A direct effect of regular moderate exercise on the prevention of IL-6-induced cachexia in the Apc(Min/+) mouse has not been investigated. The purpose of this study was to assess the effects of exercise on the development of cachexia in the Apc(Min/+) mouse.

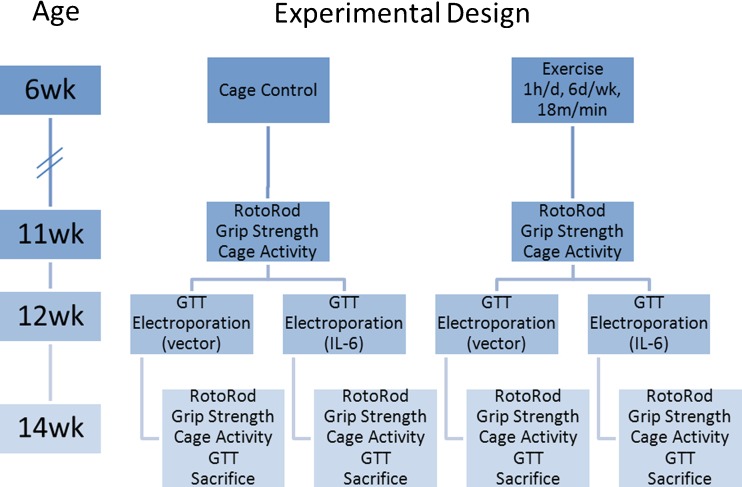
Methods: Mice were randomly assigned to moderate treadmill exercise (18 m/min, 1 h, 6 days/week, 5% grade) or cage control (CC) groups from 6 to 14 weeks of age. At 12 weeks of age, mice were electroporated with either IL-6-containing or control plasmid into the quadriceps muscle. Mice were killed after 2 weeks of systemic IL-6 overexpression or control treatment.

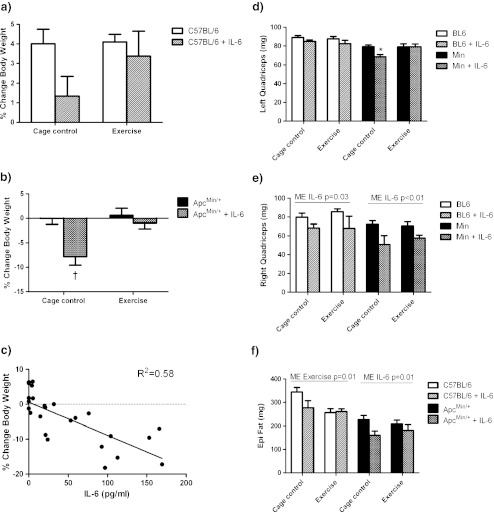
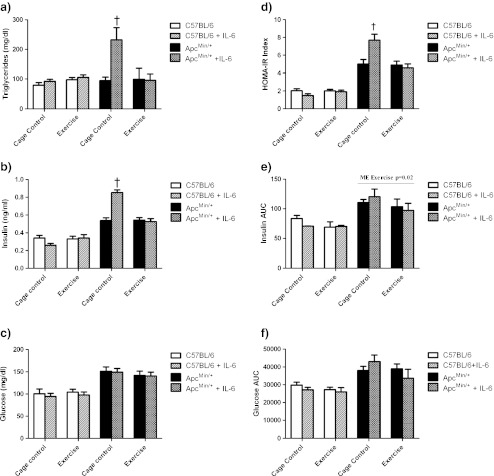
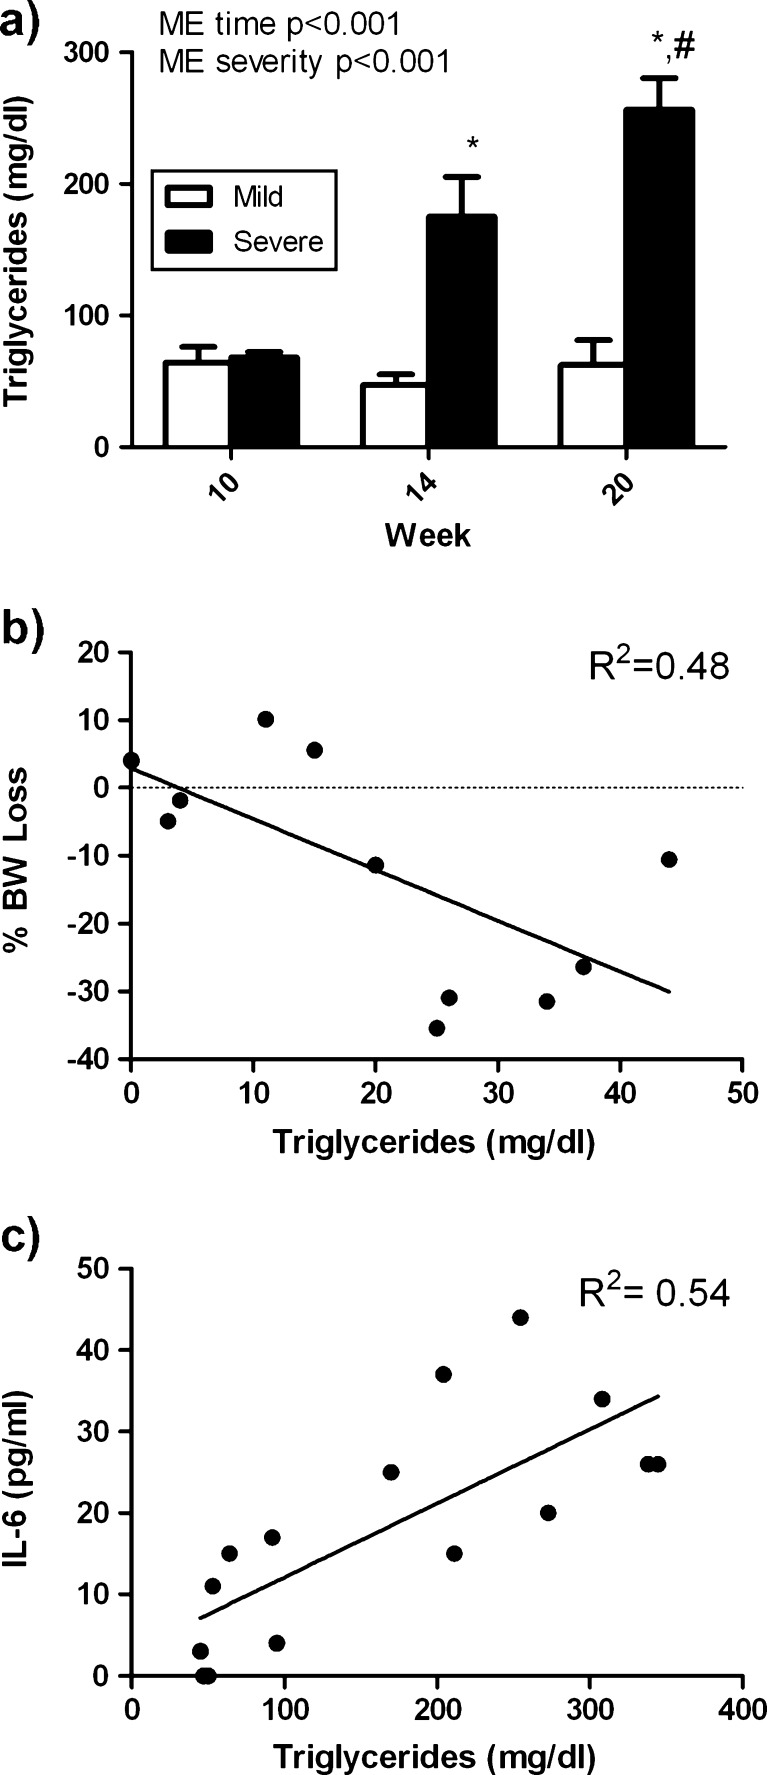
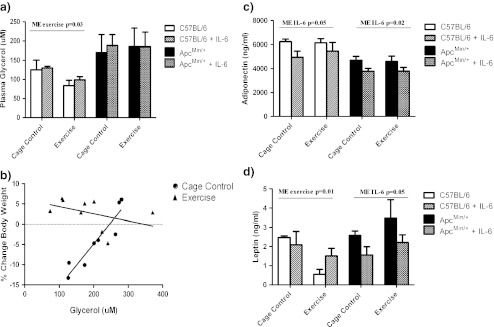
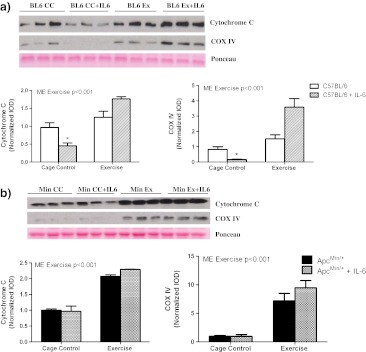
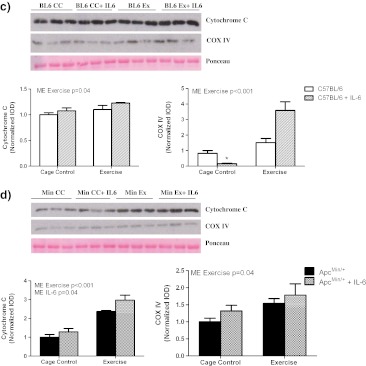
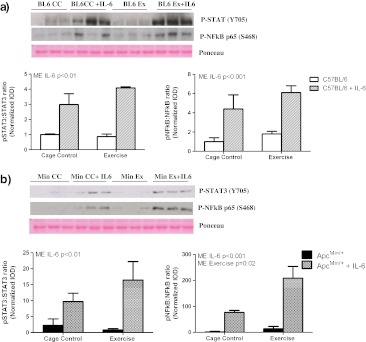
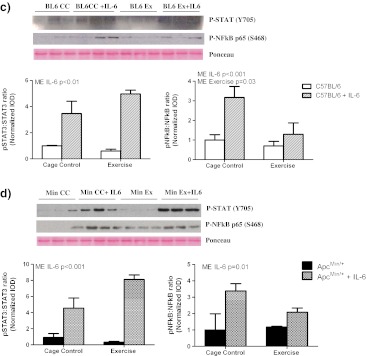
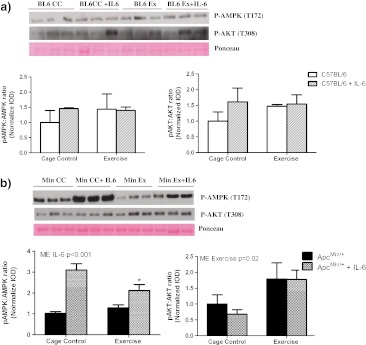
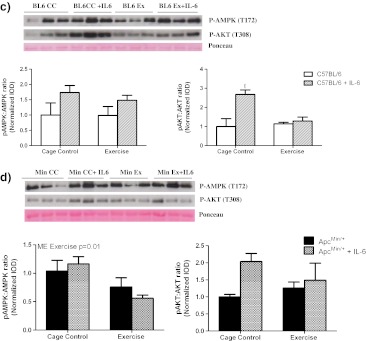
Results: IL-6 overexpression induced an 8% loss in body weight in CC mice, which was significantly attenuated by exercise. IL-6 overexpression in CC mice increased fasting insulin and triglyceride levels, which were normalized by exercise, and associated with increased oxidative capacity, an induction of AKT signaling, and a repression of AMPK signaling in muscle. These exercise-induced changes occurred despite elevated inflammatory signaling in skeletal muscle.

Conclusion: We conclude that moderate-intensity exercise can attenuate IL-6-dependent cachexia in Apc(Min/+) mice, independent of changes in IL-6 concentration and muscle inflammatory signaling. The exercise effect was associated with improved insulin sensitivity and improved energy status in the muscle.


Figures

Fig. 1
Fig. 1
Schematic of experimental design. Mice started the exercise regimen at 6 weeks of age, after being acclimated to the treadmill at 5 weeks of age. Mice ran 6 days/week for 1 h at 18 m/min at the beginning of the dark cycle. At 12 weeks of age, functional measurements were taken including grip strength and RotoRod performance. A glucose tolerance test was conducted and then the mice were electroporated. After 2 weeks of IL-6 overexpression (14 weeks), functional measures and a glucose tolerance test were conducted and mice were killed
Fig. 2
Fig. 2
Effect of exercise and IL-6 overexpression on body weight and muscle and fat mass in wild-type and Apc Min/+ mice. IL-6 was overexpressed for 2 weeks in mice from 12 to 14 weeks of age undergoing treadmill exercise or serving as cage control. The percent change in body weight was calculated from values at 12 and 14 weeks of age in wild-type (a) and Apc Min/+ mice (b). c The percent body weight loss correlates to the levels of IL-6 in cage control Apc Min/+ mice. d Changes in quadriceps weight from systemic IL-6 overexpression. e Changes in quadriceps weight from local IL-6 overexpression. f Changes in epidydimal fat pad weight from 2 weeks of IL-6 overexpression. Values are the means ± SE. Data were analyzed with two-way ANOVA. Significance was set at p ≤ 0.05. Different from all others
Fig. 3
Fig. 3
Glucose metabolism after 2 weeks of IL-6 overexpression with and without exercise intervention. At 14 weeks of age, fasting triglycerides (a), fasting insulin (b), and fasting glucose (c) were measured after a 5-h fast. Insulin resistance was monitored by calculating the HOMA-IR index (d) and a glucose tolerance test. In a subset of mice (n = 5–7/group), an intraperitoneal glucose tolerance test was conducted after an overnight fast. Blood glucose was measured at 0, 15, 13, 60, 90, and 120 min. Insulin area under the curve (AUC) (e) and glucose AUC (f) were calculated from values obtained during the glucose tolerance test. Values are the means ± SE. Data were analyzed with two-way ANOVA within each genotype. Significance was set at p ≤ 0.05. *Interaction between IL-6 and cage control
Fig. 4
Fig. 4
Circulating triglycerides are increased with severity of cancer cachexia. Fasting triglycerides were measured at 10, 14, and 20 weeks of age in Apc Min/+ mice and data stratified by cachexia severity. a Fasting triglycerides measured at 10, 14, and 20 weeks from mild and severely cachectic Apc Min/+ mice. Samples were taken from the same mice at three different ages. b Circulating triglycerides correlate with percent body weight loss from peak body weight to body weight at 20 weeks (p = 0.01). c Circulating triglycerides correlate with plasma IL-6 levels at 20 weeks of age (p = 0.001). Values are the means ± SE. Data were analyzed with repeated measures two-way ANOVA and Pearson’s correlation. Significance was set at p ≤ 0.05
Fig. 5
Fig. 5
Lipid metabolism after 2 weeks of IL-6 overexpression with and without exercise training. a At 14 weeks of age, plasma glycerol was measured in a subset of mice (n = 5) after a 5-h fast. b Fasting glycerol levels in cage control Apc Min/+ mice (circles) correlated with percent change in body weight (R 2 = 0.87, p < 0.001). Fasting glycerol levels in exercised Apc Min/+ mice (triangles) were not correlated with percent change in body weight (R 2 = 0.18, p = 0.26). Plasma concentrations of adiponectin (c) and leptin (d) were measured after 2 weeks of IL-6 overexpression. Mice were fasted for 5 h prior to the collection of plasma samples at the time of killing. Values are the means ± SE. Data were analyzed with two-way ANOVA. Pearson’s correlation analysis was performed to compare percent change in body weight with glycerol levels in the Apc Min/+ mice. Significance was set at p ≤ 0.05
Fig. 6
Fig. 6
Effect of local and systemic IL-6 overexpression and exercise on muscle oxidative capacity. To measure the effect of systemic IL-6 overexpression, the relative protein expression of cytochrome C and COX IV was measured in the wild-type left quadriceps muscle (a) and the Apc Min/+ left quadriceps muscle (b). The effects of local IL-6 overexpression on protein expression of cytochrome c and COX IV were measured in the right quadriceps muscle of wild-type (c) and Apc Min/+ (d) mice. All data were normalized to cage control (CC). Values are the means ± SE. Data were analyzed with two-way ANOVA. Significance was set at p ≤ 0.05. *Effect of IL-6 within cage control
Fig. 6
Fig. 6
Effect of local and systemic IL-6 overexpression and exercise on muscle oxidative capacity. To measure the effect of systemic IL-6 overexpression, the relative protein expression of cytochrome C and COX IV was measured in the wild-type left quadriceps muscle (a) and the Apc Min/+ left quadriceps muscle (b). The effects of local IL-6 overexpression on protein expression of cytochrome c and COX IV were measured in the right quadriceps muscle of wild-type (c) and Apc Min/+ (d) mice. All data were normalized to cage control (CC). Values are the means ± SE. Data were analyzed with two-way ANOVA. Significance was set at p ≤ 0.05. *Effect of IL-6 within cage control
Fig. 7
Fig. 7
Effect of local and systemic IL-6 overexpression and exercise on STAT3 and NFkB markers of muscle inflammation. To measure the effect of systemic IL-6 overexpression, the relative protein expression of p-STAT3(Y705) and p-NFkB(S468) was measured and normalized to levels of total STAT3 and NFkB in the wild-type left quadriceps muscle (a) and the Apc Min/+ left quadriceps muscle (b). The effects of local IL-6 overexpression on the protein expression of p-STAT3(Y705) and p-NFkB(S468) were measured and normalized to the levels of total STAT3 and NFkB in the wild-type right quadriceps muscle (c) and the Apc Min/+ right quadriceps muscle (d). All data were normalized to cage control (CC). Values are the means ± SE. Data were analyzed with two-way ANOVA. Significance was set at p ≤ 0.05
Fig. 7
Fig. 7
Effect of local and systemic IL-6 overexpression and exercise on STAT3 and NFkB markers of muscle inflammation. To measure the effect of systemic IL-6 overexpression, the relative protein expression of p-STAT3(Y705) and p-NFkB(S468) was measured and normalized to levels of total STAT3 and NFkB in the wild-type left quadriceps muscle (a) and the Apc Min/+ left quadriceps muscle (b). The effects of local IL-6 overexpression on the protein expression of p-STAT3(Y705) and p-NFkB(S468) were measured and normalized to the levels of total STAT3 and NFkB in the wild-type right quadriceps muscle (c) and the Apc Min/+ right quadriceps muscle (d). All data were normalized to cage control (CC). Values are the means ± SE. Data were analyzed with two-way ANOVA. Significance was set at p ≤ 0.05
Fig. 8
Fig. 8
Effect of local and systemic IL-6 overexpression and exercise on AKT and AMPK markers of energy status. To measure the effect of systemic IL-6 overexpression, the relative protein expression of phosphorylated (T172) AMPK and phosphorylated (T308) AKT was measured and normalized to the levels of total AMPK and AKT in the wild-type left quadriceps muscle (a) and the Apc Min/+ left quadriceps muscle (b). The effects of local IL-6 overexpression on the protein expression of phosphorylated (T172) AMPK and phosphorylated (T308) AKT were measured and normalized to the levels of total AMPK and AKT in the wild-type right quadriceps muscle (c) and the Apc Min/+ right quadriceps muscle (d). Values are the means ± SE. Data were analyzed with two-way ANOVA. Significance was set at p ≤ 0.05. *Effect of exercise within IL-6
Fig. 8
Fig. 8
Effect of local and systemic IL-6 overexpression and exercise on AKT and AMPK markers of energy status. To measure the effect of systemic IL-6 overexpression, the relative protein expression of phosphorylated (T172) AMPK and phosphorylated (T308) AKT was measured and normalized to the levels of total AMPK and AKT in the wild-type left quadriceps muscle (a) and the Apc Min/+ left quadriceps muscle (b). The effects of local IL-6 overexpression on the protein expression of phosphorylated (T172) AMPK and phosphorylated (T308) AKT were measured and normalized to the levels of total AMPK and AKT in the wild-type right quadriceps muscle (c) and the Apc Min/+ right quadriceps muscle (d). Values are the means ± SE. Data were analyzed with two-way ANOVA. Significance was set at p ≤ 0.05. *Effect of exercise within IL-6

Similar articles

Cited by

References

    1. Deans C, Wigmore SJ. Systemic inflammation, cachexia and prognosis in patients with cancer. Curr Opin Clin Nutr Metab Care. 2005;8:265–269. doi: 10.1097/01.mco.0000165004.93707.88. - DOI - PubMed
    1. Tisdale MJ. The ‘cancer cachectic factor’. Support Care Cancer. 2003;11:73–78. - PubMed
    1. Carson JA, Baltgalvis KA. Interleukin 6 as a key regulator of muscle mass during cachexia. Exerc Sport Sci Rev. 2010;38:168–176. doi: 10.1097/JES.0b013e3181f44f11. - DOI - PMC - PubMed
    1. Moser AR, Pitot HC, Dove WF. A dominant mutation that predisposes to multiple intestinal neoplasia in the mouse. Science. 1990;247:322–324. doi: 10.1126/science.2296722. - DOI - PubMed
    1. Baltgalvis KA, Berger KA, Pena MM, et al. Interleukin-6 and cachexia in ApcMin/+ mice. Am J Physiol Regul Integr Comp Physiol. 2008;294:R393–R401. doi: 10.1152/ajpregu.00716.2007. - DOI - PubMed

LinkOut - more resources