. 2012 Jul;74(5):891-910.
doi: 10.3758/s13414-012-0292-1.

The plateau in mnemonic resolution across large set sizes indicates discrete resource limits in visual working memory

Affiliations

The plateau in mnemonic resolution across large set sizes indicates discrete resource limits in visual working memory

David E Anderson et al. Atten Percept Psychophys. 2012 Jul.

Retraction in

Abstract

The precision of visual working memory (WM) representations declines monotonically with increasing storage load. Two distinct models of WM capacity predict different shapes for this precision-by-set-size function. Flexible-resource models, which assert a continuous allocation of resources across an unlimited number of items, predict a monotonic decline in precision across a large range of set sizes. Conversely, discrete-resource models, which assert a relatively small item limit for WM storage, predict that precision will plateau once this item limit is exceeded. Recent work has demonstrated such a plateau in mnemonic precision. Moreover, the set size at which mnemonic precision reached asymptote has been strongly predicted by estimated item limits in WM. In the present work, we extend this evidence in three ways. First, we show that this empirical pattern generalizes beyond orientation memory to color memory. Second, we rule out encoding limits as the source of discrete limits by demonstrating equivalent performance across simultaneous and sequential presentations of the memoranda. Finally, we demonstrate that the analytic approach commonly used to estimate precision yields flawed parameter estimates when the range of stimulus space is narrowed (e.g., a 180º rather than a 360º orientation space) and typical numbers of observations are collected. Such errors in parameter estimation reconcile an apparent conflict between our findings and others based on different stimuli. These findings provide further support for discrete-resource models of WM capacity.


Figures

Fig. 1
Fig. 1
Color recall task used in Experiment 1. Participants maintained fixation and were instructed to remember the colors of all objects presented on the display. The set sizes used were 1–6. After a short delay period, participants were probed to recall the color of one object presented in the memory display (demarcated with a thicker white ring). Participants responded by clicking on the location of the color wheel that corresponded to the color that they remembered the probed item being
Fig. 2
Fig. 2
Response histograms for target- and distractor-related responses in Experiment 1. (Top) Response offset histograms for each set size. Response offsets were calculated as the deviations of the participants’ responses from the values of the target colors. Each histogram was fitted using the parameters of the discrete-resource model (red) and the flexible-resource model (green). (Bottom) Distractor response offset histograms. Responses for each trial were subtracted from all distractor values within each display and binned according to set size. The absence of a central tendency in the distractor offset distributions suggests that mislocalizations were not prevalent
Fig. 3
Fig. 3
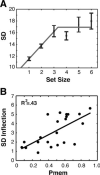
Bilinear fits and individual-differences analysis. (a) The precision-by-set-size functions (black) from Experiment 1 were fitted with a bilinear function (gray). (b) The correlations (p < .001) between individual item limits and asymptotes in precision in Experiment 1
Fig. 4
Fig. 4
The simultaneous/sequential recall task used in Experiment 2. Participants maintained fixation and were instructed to remember the orientations of all objects presented on the displays. Simultaneous displays required participants to remember one, two, three, four, six, or eight items presented within one display, and sequential displays required participants to remember two, four, six, or eight items presented across two displays. After a short delay period, participants were probed to recall the orientation of one object presented, as indicated by the thicker black ring. Participants responded by clicking on the location on the ring where they remembered the center of the gap being
Fig. 5
Fig. 5
Response histograms for target- and distractor-related responses during simultaneous trials in Experiment 2. (Top) Response offset histograms for each set size. Response offsets were calculated as the deviations of the participants’ responses from the values of the target orientations. Each histogram was fitted using the parameters of the discrete-resource model (red) and the flexible-resource model (green). (Bottom) Distractor response offset histograms. Responses for each trial were subtracted from all distractor values within each display and binned according to set size. The absence of a central tendency in the distractor offset distributions suggests that mislocalizations were not prevalent
Fig. 6
Fig. 6
Response histograms for target- and distractor-related responses during sequential trials in Experiment 2. (Top) Response offset histograms for each set size. Response offsets were calculated as the deviations of the participants’ responses from the values of the target orientations. Each histogram was fitted using the parameters of the discrete-resource model (red) and the flexible-resource model (green). (Bottom) Distractor response offset histograms. Responses for each trial were subtracted from all distractor values within each display and binned according to set size. The absence of a central tendency in the distractor offset distributions suggests that mislocalizations were not prevalent
Fig. 7
Fig. 7
Bilinear fits and individual-differences analysis. (a) The precision-by-set-size functions (black) from simultaneous trials were fitted with a bilinear function (gray). (b) A comparison of the precision estimates obtained from simultaneous (black) and sequential (white) trials. No main effects or interactions were observed. (c) Correlations (p < .001) between individual item limits and asymptotes in precision in simultaneous trials. (d) Correlations (p < .001) between individual item limits and asymptotes in precision in sequential trials
Fig. 8
Fig. 8
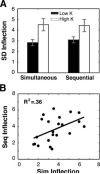
Comparison of asymptotes in precision across simultaneous and sequential presentations. (a) Median splits on WM capacity (set size 8 Pmem) show no systematic difference in asymptotes in precision for either low-capacity (black) or high-capacity (white) individuals. (b) Correlations (p < .01) between the asymptotes in precision in simultaneous and sequential displays
Fig. 9
Fig. 9
The recall task used in Experiment 3. The stimuli utilized either 360° or 180° of stimulus space and were blocked. The recall procedures were similar to those in Experiment 2
Fig. 10
Fig. 10
Response histograms for target- and distractor-related responses in Experiment 3. (Top) Response offset histograms for each set size. Response offsets were calculated as the deviations of the participants’ responses from the values of the target orientations. Each histogram was fitted using the parameters of the discrete-resource model (red) and the flexible-resource model (green). (Bottom) Distractor response offset histograms. Responses for each trial were subtracted from all distractor values within each display and binned according to set size. The absence of a central tendency in the distractor offset distributions suggests that mislocalizations were not prevalent
Fig. 11
Fig. 11
Response histograms for target- and distractor-related responses in Experiment 3. (Top) Response offset histograms for each set size. Response offsets were calculated as the deviations of the participants’ responses from the values of the target orientations. Each histogram was fitted using the parameters of the discrete-resource model (red) and the flexible-resource model (green). (Bottom) Distractor response offset histograms. Responses for each trial were subtracted from all distractor values within each display and binned according to set size. The absence of a central tendency in the distractor offset distributions suggests that mislocalizations were not prevalent
Fig. 12
Fig. 12
Precision functions and individual-differences analysis. (a) The precision-by-set-size functions for stimuli utilizing 360° (black) and 180° (gray) of stimulus space. (b) The Pmem-by-set-size functions for stimuli utilizing 360° (black) and 180° (gray) of stimulus space. (c) Correlations (p < .05) between individual item limits (estimated from the 180° condition) and asymptotes in precision (estimated from the 360° condition). (d) Correlations (p = .89) between individual item limits (estimated from the 180° condition) and asymptotes in precision (estimated from the 360° condition)
Fig. 13
Fig. 13
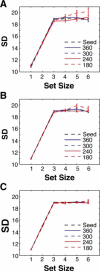
Parameter estimates from simulated data obtained through parametric variation of trial number and stimulus space. The same underlying assumptions for simulations were used across conditions—namely, the seed values for parameter estimates across set sizes and the bilinearity of the seed precision functions. Each panel represents different trial numbers simulated: 120 (a), 300 (b), or 1,000 (c). When 120 or 300 trials were simulated in 180° of stimulus space, the resulting estimated precision function was fit equally well by a bilinear and a logarithmic model. All other conditions were better fit by a bilinear function, which was consistent with the underlying seed parameters
Fig. 14
Fig. 14
Parameter estimates from simulated data obtained through parametric variation of stimulus space. The same underlying assumptions for simulations were used across stimulus spaces—namely, the seed values for parameter estimates across set sizes and the logarithmic nature of the seed precision function. The recovered precision functions obtained through simulations of 180° and 360° of space were better characterized by a logarithmic function than by a bilinear function
Fig. 15
Fig. 15
Effects of distribution density on parameter estimation. (a) Manipulations of seed SD (x-axis), trial number [120 (dotted), 300 (dashed), or 360 (solid)], and linear transformation coefficient [m = 1 (top), 2 (middle), or 3 (bottom)] on the mean squared error (MSE) of the seed SD and parameter estimates obtained from the fitted von Mises distribution. The results indicate that increasing SD (p < .001), decreasing trial number (p < .001), and increasing linear transformation coefficient (p < .05) lead to increases in MSE, which translate to less reliable parameter estimates. (b) A simulation of how many trials were required to meet criterion (MSE < 1) as a function of seed SD (slope = 13.3 trials/deg). The significant positive slope indicates that more trials are required to recover the underlying precision parameter as SD increases

Comment in

  • Findings of research misconduct.
    [No authors listed] [No authors listed] NIH Guide Grants Contracts (Bethesda). 2015 Aug 14:NOT-OD-15-141. NIH Guide Grants Contracts (Bethesda). 2015. PMID: 26306340 Free PMC article. No abstract available.
  • Findings of Research Misconduct.
    [No authors listed] [No authors listed] Fed Regist. 2015 Jul 31;80(147):45661-45662. Fed Regist. 2015. PMID: 27737259 Free PMC article. No abstract available.

References

    1. Anderson DE, Vogel EK, Awh E. Precision in visual working memory reaches a stable plateau when individual item limits are exceeded. Journal of Neuroscience. 2011;31:1128–1138. doi:10.1523/JNEUROSCI.4125-10.2011. - PMC - PubMed
    1. Awh E, Barton B, Vogel EK. Visual working memory represents a fixed number of items regardless of complexity. Psychological Science. 2007;18:622–628. doi:10.1111/j.1467-9280.2007.01949.x. - PubMed
    1. Awh E, Jonides J. Overlapping mechanisms of attention and spatial working memory. Trends in Cognitive Sciences. 2001;5:119–126. doi:10.1016/S1364-6613(00)01593-X. - PubMed
    1. Barton B, Ester EF, Awh E. Discrete resource allocation in visual working memory. Journal of Experimental Psychology: Human Perception and Performance. 2009;35:1359–1367. doi:10.1037/a0015792. - PMC - PubMed
    1. Bays PM, Catalao RFG, Husain M. The precision of visual working memory is set by allocation of a shared resource. Journal of Vision. 2009;7(10):1–11. doi:10.1167/9.10.7. - PMC - PubMed

Publication types

LinkOut - more resources