

Role of methylglyoxal in essential hypertension
- PMID: 22477591
- PMCID: PMC3005411
- DOI: 10.1055/s-0031-1278375
Role of methylglyoxal in essential hypertension
Abstract
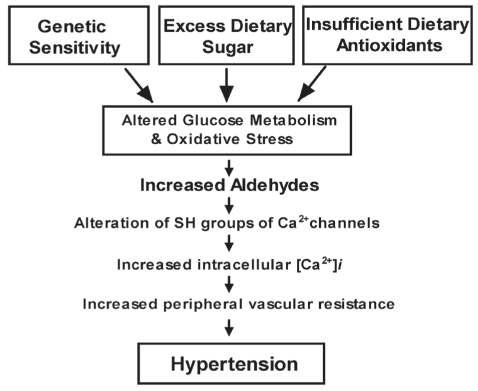
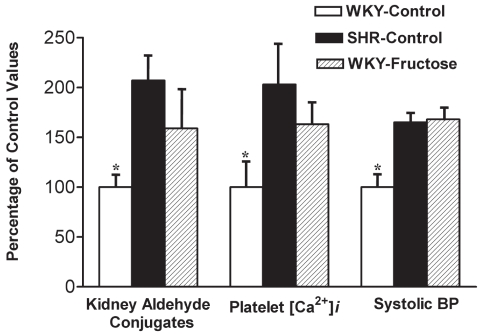
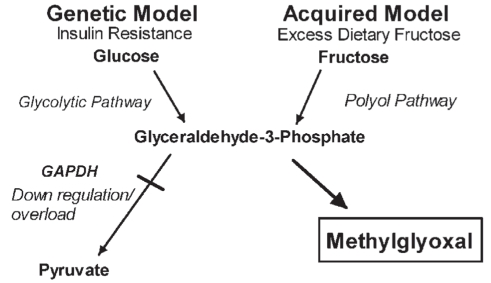
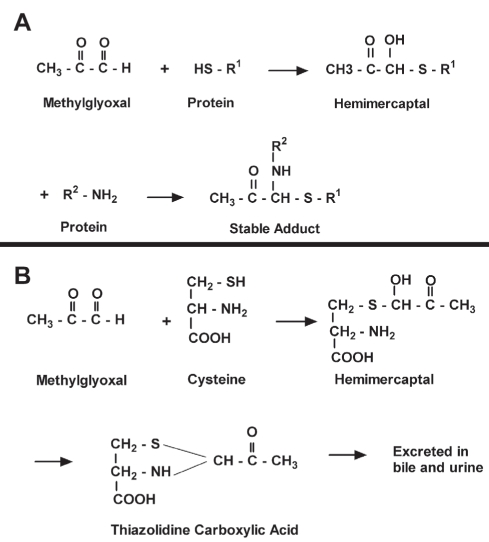
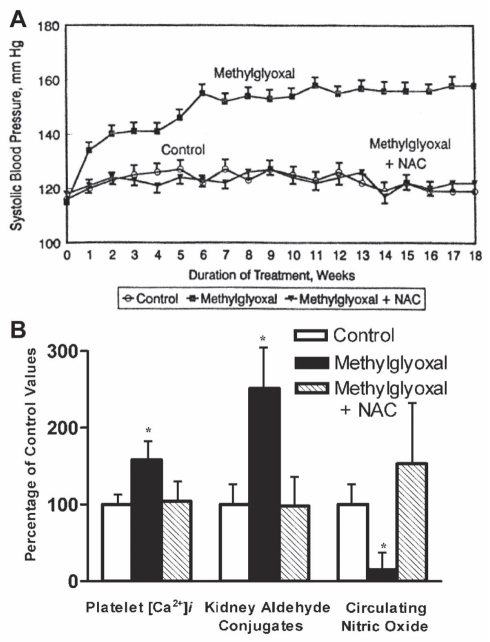
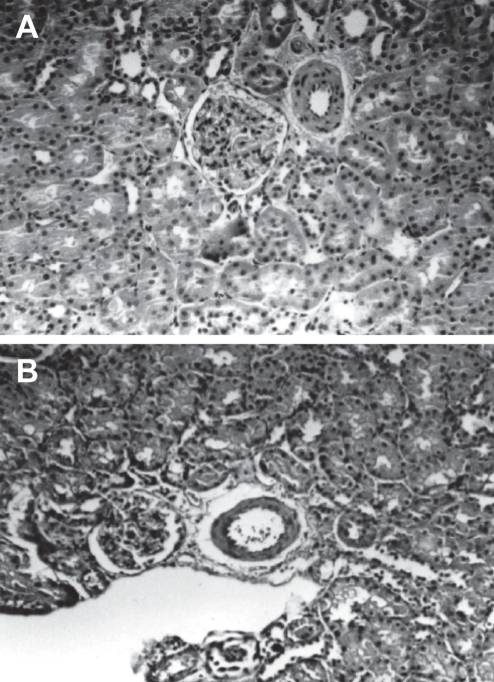
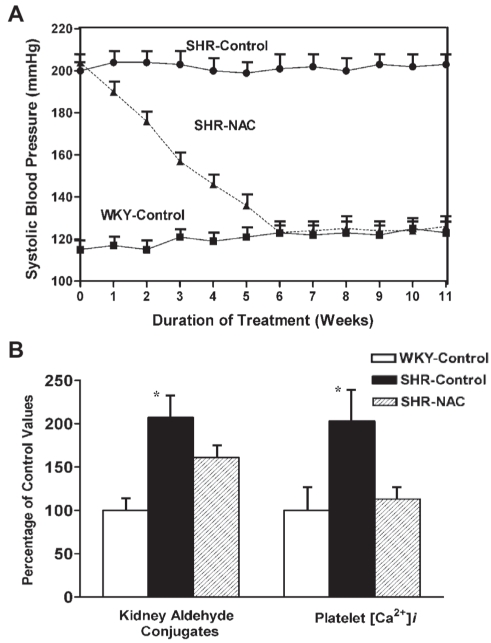
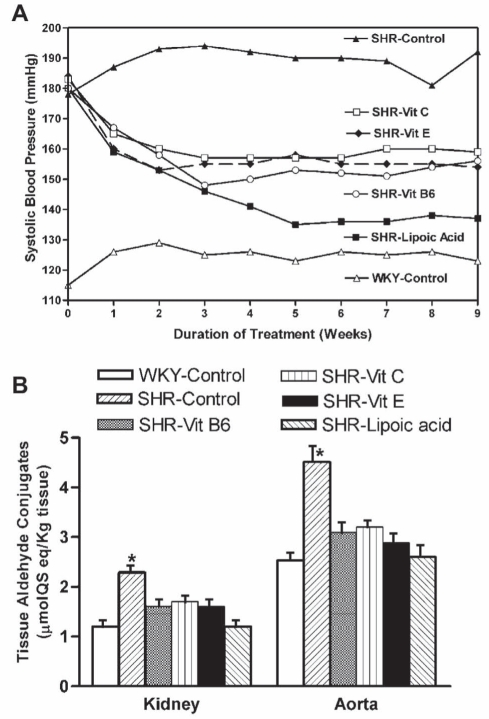
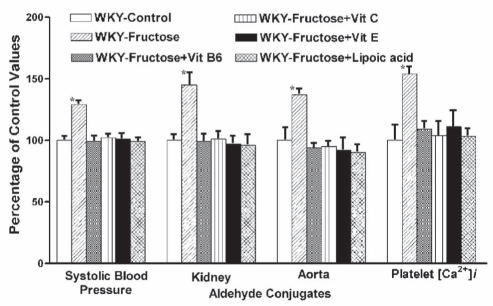
Altered glucose metabolism due to insulin resistance is a common feature of essential hypertension in humans and in animal models. Elevated endogenous aldehydes in genetic (spontaneously hypertensive rats) and acquired (fructose-induced hypertensive rats) models of essential hypertension may be due to increased production of the reactive aldehyde methylglyoxal, resulting from altered glucose metabolism. Excess methylglyoxal binds sulfhydryl groups of membrane proteins, altering calcium channels and increasing cytosolic free Ca(2+) and blood pressure. It has been demonstrated that methylglyoxal, when given in drinking water to Wistar-Kyoto rats, leads to an increase in kidney aldehyde conjugates, cytosolic free Ca(2+) concentration, decreased serum nitric oxide, renal vascular hyperplasia and hypertension. N-acetylcysteine (NAC) in the diet of these animals prevented hypertension and associated biochemical and morphological changes. NAC normalizes blood pressure by directly binding to excess methylglyoxal, thus normalizing Ca(2+) channels, cytosolic Ca(2+) and nitric oxide. NAC also leads to increased levels of tissue glutathione, a storage form of cysteine. Glutathione acts as a cofactor in the enzymatic catabolism of methylglyoxal. Cysteine and other antioxidants, such as vitamins B(6), C and E, and lipoic acid, prevented hypertension and associated biochemical and morphological changes in both genetic and acquired rat models of hypertension. The antihypertensive effect of dietary antioxidants may be due to an increase in tissue cysteine and glutathione, which improves glucose metabolism and decreases tissue methylglyoxal. A diet rich in these antioxidants may be effective in preventing and controlling hypertension in humans.
Figures
Similar articles
-
Aldehyde induced hypertension in rats: prevention by N-acetyl cysteine.Artery. 1998;23(1):10-36. Artery. 1998. PMID: 10846614
-
Dietary alpha-lipoic acid supplementation lowers blood pressure in spontaneously hypertensive rats.J Hypertens. 2000 May;18(5):567-73. doi: 10.1097/00004872-200018050-00009. J Hypertens. 2000. PMID: 10826559
-
Dietary lipoic acid supplementation prevents fructose-induced hypertension in rats.Nutr Metab Cardiovasc Dis. 2000 Dec;10(6):339-46. Nutr Metab Cardiovasc Dis. 2000. PMID: 11302009
-
Prevention of fructose-induced hypertension by dietary vitamins.Clin Biochem. 2004 Jan;37(1):1-9. doi: 10.1016/j.clinbiochem.2003.09.003. Clin Biochem. 2004. PMID: 14675555 Review.
-
Role of advanced glycation end products in hypertension and atherosclerosis: therapeutic implications.Cell Biochem Biophys. 2007;49(1):48-63. doi: 10.1007/s12013-007-0039-0. Cell Biochem Biophys. 2007. PMID: 17873339 Review.
Cited by
-
Molecular Assessment of Methylglyoxal-Induced Toxicity and Therapeutic Approaches in Various Diseases: Exploring the Interplay with the Glyoxalase System.Life (Basel). 2024 Feb 17;14(2):263. doi: 10.3390/life14020263. Life (Basel). 2024. PMID: 38398772 Free PMC article. Review.
-
Placental Methylglyoxal in Preeclampsia: Vascular and Biomarker Implications.Hypertension. 2024 Jul;81(7):1537-1549. doi: 10.1161/HYPERTENSIONAHA.123.22633. Epub 2024 May 16. Hypertension. 2024. PMID: 38752345 Free PMC article.
-
Isosamidin from Peucedanum japonicum Roots Prevents Methylglyoxal-Induced Glucotoxicity in Human Umbilical Vein Endothelial Cells via Suppression of ROS-Mediated Bax/Bcl-2.Antioxidants (Basel). 2020 Jun 17;9(6):531. doi: 10.3390/antiox9060531. Antioxidants (Basel). 2020. PMID: 32560521 Free PMC article.
-
Interplay among Oxidative Stress, Methylglyoxal Pathway and S-Glutathionylation.Antioxidants (Basel). 2020 Dec 28;10(1):19. doi: 10.3390/antiox10010019. Antioxidants (Basel). 2020. PMID: 33379155 Free PMC article. Review.
-
Elevated Methylglyoxal: An Elusive Risk Factor Responsible for Early-Onset Cardiovascular Diseases in People Living with HIV-1 Infection.Viruses. 2025 Apr 8;17(4):547. doi: 10.3390/v17040547. Viruses. 2025. PMID: 40284990 Free PMC article. Review.
References
-
- Reaven GM. Insulin resistance, hyperinsulinemia, and hypertriglyceridemia in the etiology and clinical course of hypertension. Am J Med. 1991;90(2A):7S–12S. - PubMed
-
- Ferrannini E, Buzzigoli G, Bonadonna R, et al. Insulin resistance in essential hypertension. N Eng J Med. 1987;317:350–7. - PubMed
-
- Levy J, Zemel MB, Sowers JR. Role of cellular calcium metabolism in abnormal glucose metabolism, and diabetic hypertension. Am J Med. 1989;87(6A):7S–16S. - PubMed
-
- Vasdev S, Ford CA, Longerich L, Gadag V, Wadhawan S. Role of aldehydes in fructose induced hypertension. Mol Cell Biochem. 1998;181:1–9. - PubMed
-
- Vasdev S, Mian T, Ford CA, Longerich L, Parai S. Role of aldehydes in spontaneously hypertensive rats and disulfiram-induced hypertensive rats. Nutr Metab Cardiovasc Dis. 1996;6:130–40.
LinkOut - more resources
Full Text Sources
Miscellaneous
