. 2012;10(3):e1001293.
doi: 10.1371/journal.pbio.1001293. Epub 2012 Mar 27.

Reasoning, learning, and creativity: frontal lobe function and human decision-making

Affiliations

Reasoning, learning, and creativity: frontal lobe function and human decision-making

Anne Collins et al. PLoS Biol. 2012.

Abstract

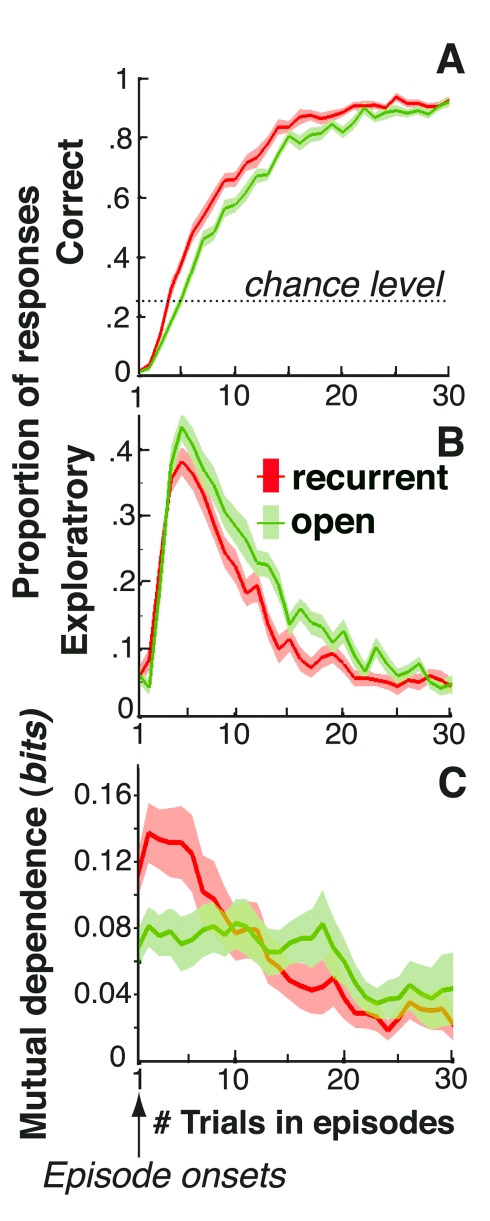
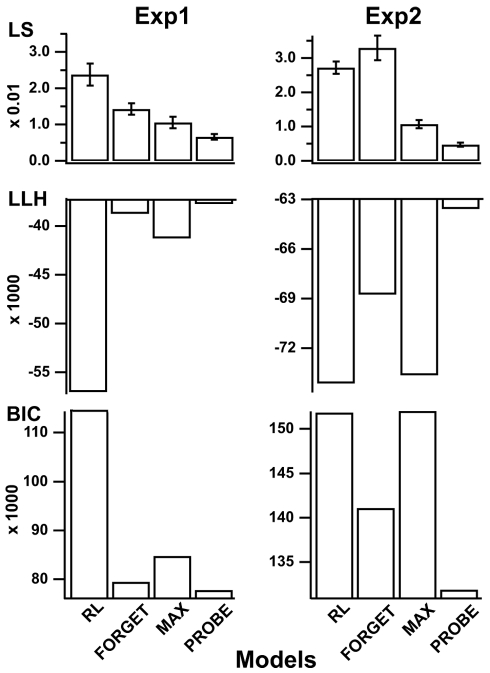
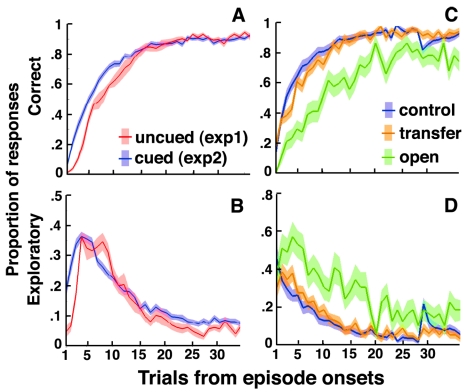
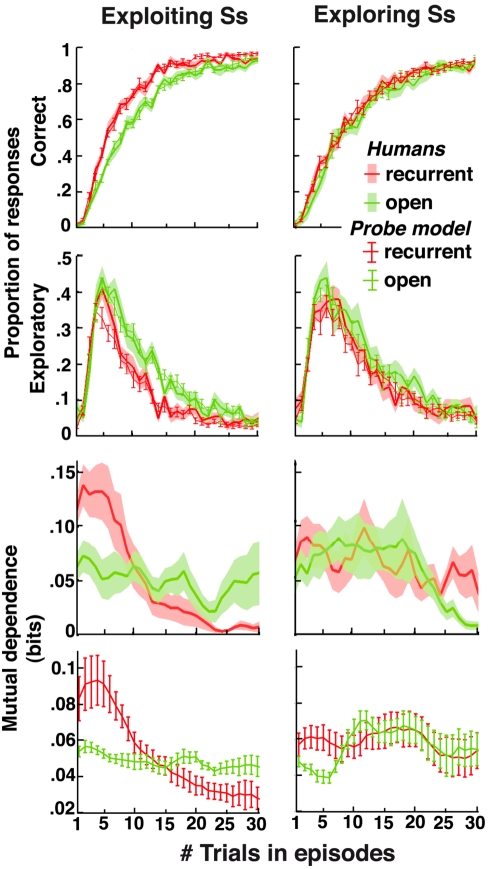
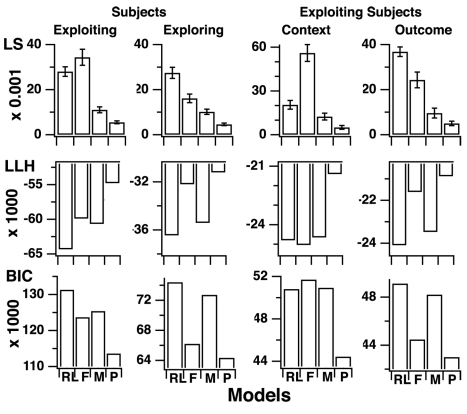
The frontal lobes subserve decision-making and executive control--that is, the selection and coordination of goal-directed behaviors. Current models of frontal executive function, however, do not explain human decision-making in everyday environments featuring uncertain, changing, and especially open-ended situations. Here, we propose a computational model of human executive function that clarifies this issue. Using behavioral experiments, we show that unlike others, the proposed model predicts human decisions and their variations across individuals in naturalistic situations. The model reveals that for driving action, the human frontal function monitors up to three/four concurrent behavioral strategies and infers online their ability to predict action outcomes: whenever one appears more reliable than unreliable, this strategy is chosen to guide the selection and learning of actions that maximize rewards. Otherwise, a new behavioral strategy is tentatively formed, partly from those stored in long-term memory, then probed, and if competitive confirmed to subsequently drive action. Thus, the human executive function has a monitoring capacity limited to three or four behavioral strategies. This limitation is compensated by the binary structure of executive control that in ambiguous and unknown situations promotes the exploration and creation of new behavioral strategies. The results support a model of human frontal function that integrates reasoning, learning, and creative abilities in the service of decision-making and adaptive behavior.


Conflict of interest statement

The authors have declared that no competing interests exist.

Figures

Figure 1
Figure 1. Human decisions with no contextual cues.
Participants' performances in recurrent (red) and open (green) episodes plotted against the number of trials following episode onsets. Shaded areas are S.E.M. across participants. (A) Correct response rates. (B) Exploratory response rates. (C) Mutual dependence (i.e., mutual information) of two successive correct decisions averaged over five-trial sliding bins (see Text S1).
Figure 2
Figure 2. Comparison of model fits.
Models were fitted using the standard maximum log-likelihood (LLH) and least squares (LS) methods. Histograms show the LS and LLH as well as the Bayesian information criterion (BIC) obtained for each model. The LLH method maximizes the predicted (log-)likelihood of observing actual participants' responses. The LS method minimizes the square difference between observed frequencies and predicted probabilities of correct responses. The Bayesian information criterion (BIC) alters LLH values according to model complexity favoring models with less free parameters (Text S1). Larger LLH, lower LS, and lower BIC values correspond to better fits. Left, first experiment with no contextual cues. Parameters that cannot be estimated (i.e., contextual learning rate αc and context-sensitivity bias δ) were removed from the fitting. RL, basic reinforcement learning model including a single task-set learning stimulus-response association (free parameters: inverse temperature β, noise ε, learning rate αs). Right, second experiment with contextual cues. RL, pure reinforcement learning model learning a mixture of stimulus-response and stimulus-cue-response associations (free parameters: inverse temperature β, β′ noise ε, learning rates αs and αc, and mixture rate ω; see Text S1). Note that in both experiments the PROBE model was the best fitting model for every fitting criterion (LS, all Fs>3.8, p<0.001).
Figure 3
Figure 3. Predicted versus observed decisions with no contextual cues.
Correct and exploratory response rates as well as mutual dependences of successive correct decisions in recurrent (red) and open (green) episodes plotted against the number of trials following episode onsets. Lines ± error bars (mean ± S.E.M.): performances predicted by fitted RL, FORGET, MAX, and PROBE models. RL, reinforcement learning model including a single actor learning stimulus-response associations (details in Figure 2, legend). Correct and exploratory response rates were computed in every trial according to the actual history of participants' responses. Mutual dependence of successive correct decisions predicted by each fitted model was computed as the mutual information between two successive correct responses produced by the model independently of actual participants' responses (one simulation for each participant). Stars show significant differences at p<0.05 (mutual dependences on the first eight trials between recurrent and open episodes. t tests, RL & FORGET, all ts<1. MAX, all ts<2, ps>0.06; PROBE, all ts>3.2, ps<0.004). Lines ± shaded areas (mean+S.E.M.): human performances (data from Figure 1). Insets magnify the plots for Trials 7, 8, and 9. See Table S1 for fitted model parameters. See Text S1 for the discrepancy observed in Trial 5 between participants' exploratory responses and model predictions (section “Comments on Model Fits”).
Figure 4
Figure 4. Human decisions with contextual cues.
Participants' performances are plotted against the number of trials following episode onsets. Shaded areas are S.E.M. across participants. (A and B) Correct and exploratory response rates in uncued (red) and cued (blue) recurrent episodes. Uncued recurrent episodes are from Experiment 1 for participants who performed the recurrent session before the open session (half of participants). Cued recurrent episodes correspond to the first session of the second experiment. (C and D) Correct and exploratory response rates in control (blue), transfer (orange), and open (green) episodes (second experiment, second session). In control episodes, the drop of correct response rates and the peak of exploratory response rates visible on Trial 29 corresponded to contextual cue changes while external contingencies remained unchanged (see Figure S3).
Figure 5
Figure 5. Predicted versus observed decisions with contextual cues.
Correct and exploratory response rates in control (blue), transfer (orange), and open (green) episodes plotted against the number of trials following episode onsets. Lines ± error bars (mean ± S.E.M.): performances predicted by fitted RL, FORGET, MAX, and PROBE models in every trial according to the actual history of participants' responses. The RL model includes a single actor learning a mixture of stimulus-response and stimulus-cue-response associations (see Figure 2 legend for details). Lines ±shaded areas (mean+S.E.M.): human performances (data from Figure 4C,D). See Table S1 for fitted model parameters. Note the systematic discrepancies between the predictions from RL, FORGET, and MAX models and human data.
Figure 6
Figure 6. Individual differences in decision-making with no contextual cues.
Correct and exploratory response rates as well as mutual dependence of successive correct decisions in recurrent (red) and open (green) episodes plotted against the number of trials following episode onsets (data from Experiment 1). Lines ± shaded areas (mean+S.E.M.): participants' performances. Lines ± error bars (mean ± S.E.M.): predicted performances from the fitted PROBE model. Predicted correct and exploratory response rates were computed in every trial according to the actual history of participants' responses. Predicted mutual dependence of successive correct decisions was computed as the mutual information between two successive correct responses produced by the model independently of actual participants' responses (one simulation for each participant). Left, exploiting participants: Correct responses increased and exploratory responses vanished faster in recurrent than open episodes (Wilcoxon-test, both zs>2.8, ps<0.005). Right, exploring participants: performances were similar in recurrent and open episodes (correct and exploratory responses: Wilcoxon-test, both zs<1.4, ps>0.17). See Table S2 for fitted model parameters in each group. See Text S1 for the discrepancy observed in Trial 5 between exploiting participants' exploratory responses and model predictions in recurrent episodes (section “Data Analyses”).
Figure 7
Figure 7. Individual differences in decision-making with contextual cues.
Correct and exploratory response rates in control (blue), transfer (orange), and open (green) episodes plotted against the number of trials following episode onsets (data from Experiment 2). Lines ± shaded areas (mean+S.E.M.): participants' performances. Lines ± error bars (mean ± S.E.M.): performances predicted by the fitted PROBE model in every trial according to the actual history of participants' responses. Left, context-exploiting participants: Correct responses increased and exploratory responses vanished faster in control than transfer episodes (Wilcoxon-tests, both zs>2.4, ps<0.015) and faster in transfer than open episodes (Wilcoxon-tests, both zs>3.1, ps<0.002). Middle, outcome-exploiting participants: performances were similar in control and transfer episodes (correct and exploratory responses: Wilcoxon-tests, both zs<1.4, ps>0.15), but correct responses increased and exploratory responses vanished faster in transfer than open episodes (Wilcoxon-tests, both zs>2.3, ps<0.023). Right, exploring participants: performances were similar in control, transfer, and open episodes (correct and exploratory responses: Friedmann-tests, both χ2<5.3, ps>0.07). Note that in open episodes, exploring participants adjusted faster than exploiting participants (correct responses: both ts>3.0, ps<0.004). See Table S2 for fitted model parameters in each group.
Figure 8
Figure 8. Comparison of model fits according to individual differences.
Least square residuals (LS), maximal log-likelihoods (LLH), and Bayesian information criteria (BIC) obtained for each model in exploring versus exploiting participants (left) and in context- versus outcome-exploiting participants (right). RL, reinforcement learning; F, FORGET; M, MAX; P, PROBE model. See details in the Figure 2 legend. Note that in every participants' group, the PROBE model was the best fitting model for every fitting criterion (LS, all Fs>4.2, ps<0.001 in exploiting and exploring groups; Wilcoxon tests in context- and outcome-exploiting groups, all zs>2.0, ps<0.047).

References

    1. Simon H. Models of bounded rationality: empirically grounded economic reason. Cambridge: The MIT Press; 1997.
    1. Kahneman D, Tversky A. Choices, values and frames. Cambridge University Press; 2000.
    1. Cohen J. D, McClure S. M, Yu A. J. Should I stay or should I go? How the human brain manages the trade-off between exploitation and exploration. Philos Trans R Soc Lond B Biol Sci. 2007;362:933–942. - PMC - PubMed
    1. Glimcher P. W, Camerer C. F, Fehr E, Poldrack R. A. Neuroeconomics: decision-making and the brain. London: Academic Press, Elsevier; 2009.
    1. Harlow H. F. The formation of learning sets. Psychological Review. 1949;56:51–65. - PubMed

Publication types