. 2012;8(3):e1002441.
doi: 10.1371/journal.pcbi.1002441. Epub 2012 Mar 29.

Decoding unattended fearful faces with whole-brain correlations: an approach to identify condition-dependent large-scale functional connectivity

Affiliations

Decoding unattended fearful faces with whole-brain correlations: an approach to identify condition-dependent large-scale functional connectivity

Spiro P Pantazatos et al. PLoS Comput Biol. 2012.

Abstract

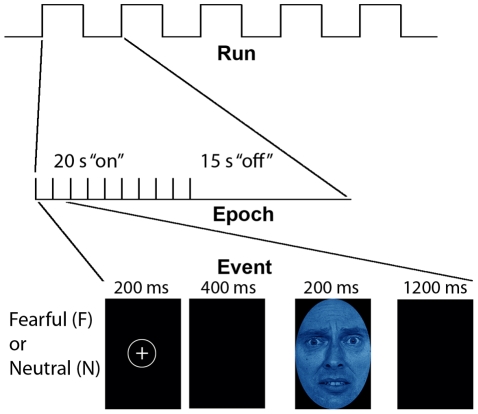
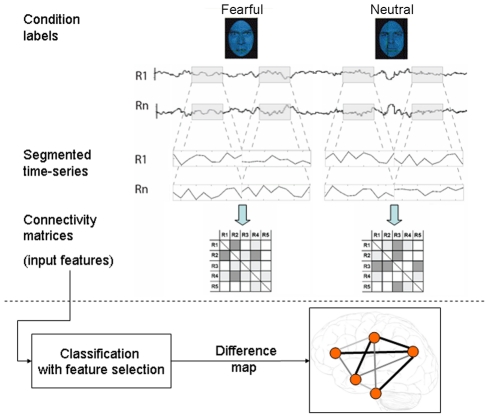
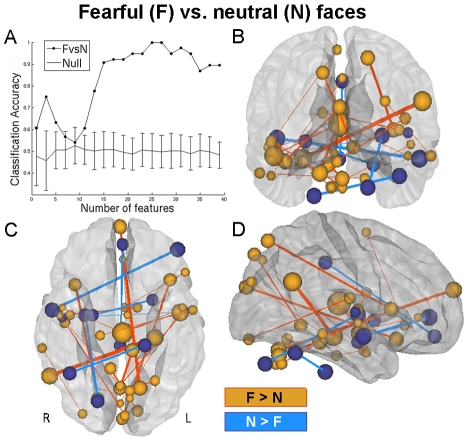
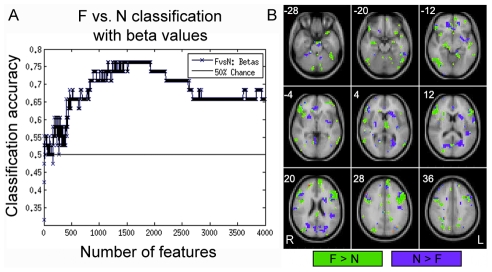
Processing of unattended threat-related stimuli, such as fearful faces, has been previously examined using group functional magnetic resonance (fMRI) approaches. However, the identification of features of brain activity containing sufficient information to decode, or "brain-read", unattended (implicit) fear perception remains an active research goal. Here we test the hypothesis that patterns of large-scale functional connectivity (FC) decode the emotional expression of implicitly perceived faces within single individuals using training data from separate subjects. fMRI and a blocked design were used to acquire BOLD signals during implicit (task-unrelated) presentation of fearful and neutral faces. A pattern classifier (linear kernel Support Vector Machine, or SVM) with linear filter feature selection used pair-wise FC as features to predict the emotional expression of implicitly presented faces. We plotted classification accuracy vs. number of top N selected features and observed that significantly higher than chance accuracies (between 90-100%) were achieved with 15-40 features. During fearful face presentation, the most informative and positively modulated FC was between angular gyrus and hippocampus, while the greatest overall contributing region was the thalamus, with positively modulated connections to bilateral middle temporal gyrus and insula. Other FCs that predicted fear included superior-occipital and parietal regions, cerebellum and prefrontal cortex. By comparison, patterns of spatial activity (as opposed to interactivity) were relatively uninformative in decoding implicit fear. These findings indicate that whole-brain patterns of interactivity are a sensitive and informative signature of unattended fearful emotion processing. At the same time, we demonstrate and propose a sensitive and exploratory approach for the identification of large-scale, condition-dependent FC. In contrast to model-based, group approaches, the current approach does not discount the multivariate, joint responses of multiple functional connections and is not hampered by signal loss and the need for multiple comparisons correction.


Conflict of interest statement

The authors have declared that no competing interests exist.

Figures

Figure 1
Figure 1. Experimental paradigm for the interaction of attention and affect (adapted from Etkin, et. al. 2004).
Stimuli were either fearful (F) or neutral (N) expression faces, pseudocolored in red, yellow,or blue. Each event was comprised of a face which was either masked (33 ms for a fearful or neutral face, followed by 167 ms of a neutral face mask of the same gender and color, but different individual; MF or MN, respectively), or unmasked (200 ms for each face; F or N) or masked. Ten events of the same type, spaced 2 seconds apart, were presented within each 20 second block, followed by 15 seconds of crosshair with black background. There were four blocks per condition, giving 40 time points in the correlation estimates per condition per subject. In view of our specific hypotheses, only the unmasked conditions are discussed in the main text, while results for unmasked conditions are presented elsewhere (manuscript in preparation).
Figure 2
Figure 2. Node definitions and anatomical locations.
Cortical and subcortical regions (ROIs) were parcellated according to bilateralized versions of the Harvard-Oxford Cortical and subcortical-atlases, and the cerebellum was parcellated according to AAL (left panel). ROIs were trimmed to ensure there was no overlap between them and that they contained voxels present in each subject. The top two eigenvariates from each ROI was extracted, resulting in 270 total nodes throughout the brain (right panel). For display purposes, node locations (black spheres) correspond to the peak loading value from each time-course's associated eigenmap averaged over all subjects.
Figure 3
Figure 3. Data analysis scheme.
Time series from each condition (unmasked fearful and unmasked neutral, F and N) and for N regions (R1 though RN) were segmented from each subject's whole run and concatenated (concatenation of two blocks for each condition shown in figure). There were four 20 second (10 TR) blocks of each condition; hence each example was comprised of 40 time points per condition per subject. For each of example, correlation matrices were estimated, in which each off-diagonal element contains Pearson's correlation coefficient between region i and region j. The lower triangular region of each of these matrices were used as input features in subsequent classifiers that learned to predict the example (i.e. F or N) based on their observed patterns of the correlations. Here, we used a filter feature selection based on t-scores in the training sets during each iteration of leave-two-out cross validation. The difference map consists of the set of most informative features (those that are included in the most rounds of cross-validation and have the highest SVM weights.)
Figure 4
Figure 4. Large-scale functional connectivity discriminates between unattended, conscious processing of fearful and neutral faces.
(A) Decoding accuracy when classifying F vs. N as a function of the number of features (1 to 40) included ranked in descending order by their absolute t-score. Maximum accuracy for F vs. N classification (100%, p<0.002, corrected) was achieved when learning was based on the top 25 features in each training set. Mean accuracy scores for shuffled data are plotted along the bottom, with error bars representing standard deviation about the mean. Posterior (B), ventral (C) and right lateralized (D) anatomical representation of the top 25 features when classifying supraliminal fearful vs. supraliminal neutral face conditions (F vs. N). The thalamus (large red sphere in the center of each view) is the largest contributor of connections the differentiate the F from N. Red indicates correlations that are greater in F, and blue represents correlations that are greater in N. For display purposes, the size of each sphere is scaled according to the sum of the SVM weights of each node's connections, while the color of each sphere is set according to the sign of this value; positive sign, red, F>N and negative sign, blue, N>F. In addition, the thickness of each connection was made proportional to its SVM weight.
Figure 5
Figure 5. Classification results using beta estimates as features.
(A) Feature selection, cross-validation and SVM learning were performed exactly the same as for FC, but over the range of 1 to 4000 ranked features (voxels). Accuracies for F vs. N classification reached 66–76% with ∼500–2500 features, with maximum accuracy (76%, p = 0.0044, uncorrected) at ∼1,900 features. (B) The most informative voxels with positive SVM weights (F>N, yellow) included fusiform gyrus (−28,−20,−12), cerebellum (−28, −20), amygdala (−20), insula (−12), orbital and ventrolateral prefrontal cortex (−20, −12, −4), midbrain (−12), parahippocampal gyrus (−12), middle temporal gyrus and superior temporal sulcus (−12,−4,4), thalamus/pulvinar (4), dorsolateral prefrontal/opercular cortex (12,20,28), dorsomedial prefrontal cortex (20,28), and superior occipital cortex (20,28) and inferior parietal lobe (36). Informative voxels with negative SVM weights (N>F, blue) included temporal-occipital cortex (−20), subgenual anterior cingulate (−12,−4), striatum (−4,4), lingual gyrus (4,12), precuneus (20) and dorsolateral prefrontal cortex (28,36). (B). Brain images are displayed using Neurological convention (i.e. L = R), and top left number in each panel represents the MNI coordinate (z) of depicted axial slice.

References

    1. Ewbank MP, Lawrence AD, Passamonti L, Keane J, Peers PV, et al. Anxiety predicts a differential neural response to attended and unattended facial signals of anger and fear. Neuroimage. 2009;44:1144–1151. - PubMed
    1. Vuilleumier P, Pourtois G. Distributed and interactive brain mechanisms during emotion face perception: Evidence from functional neuroimaging. Neuropsychologia. 2007;45:174–194. - PubMed
    1. Vuilleumier P, Armony JL, Clarke K, Husain M, Driver J, et al. Neural response to emotional faces with and without awareness: Event-related fMRI in a parietal patient with visual extinction and spatial neglect. Neuropsychologia. 2002;40:2156–2166. - PubMed
    1. Haxby JV, Hoffman EA, Gobbini MI. The distributed human neural system for face perception. Trends Cogn Sci. 2000;4:223–233. - PubMed
    1. Adolphs R, Tranel D, Damasio AR. Dissociable neural systems for recognizing emotions. Brain Cogn. 2003;52:61–69. - PubMed

Publication types