. 2012;8(3):e1002610.
doi: 10.1371/journal.pgen.1002610. Epub 2012 Mar 29.

Accurate prediction of inducible transcription factor binding intensities in vivo

Affiliations

Accurate prediction of inducible transcription factor binding intensities in vivo

Michael J Guertin et al. PLoS Genet. 2012.

Abstract

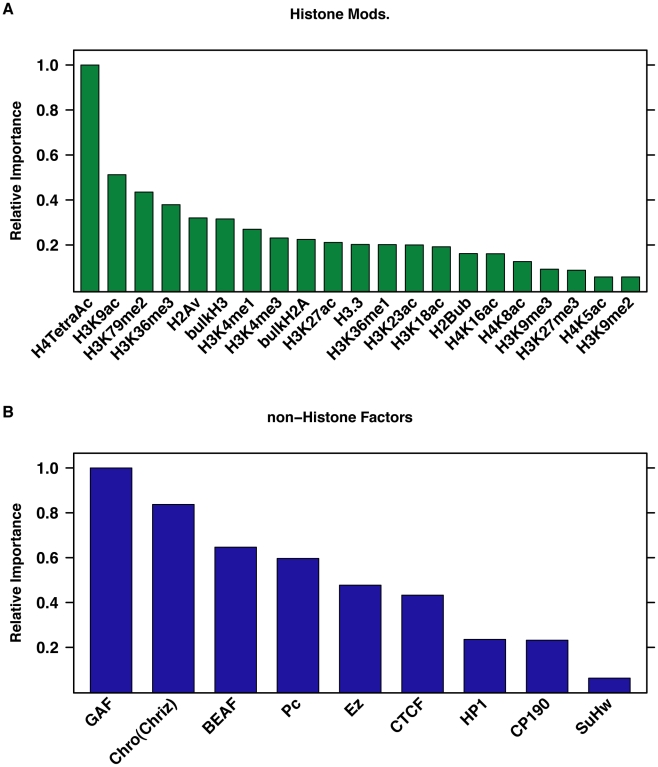
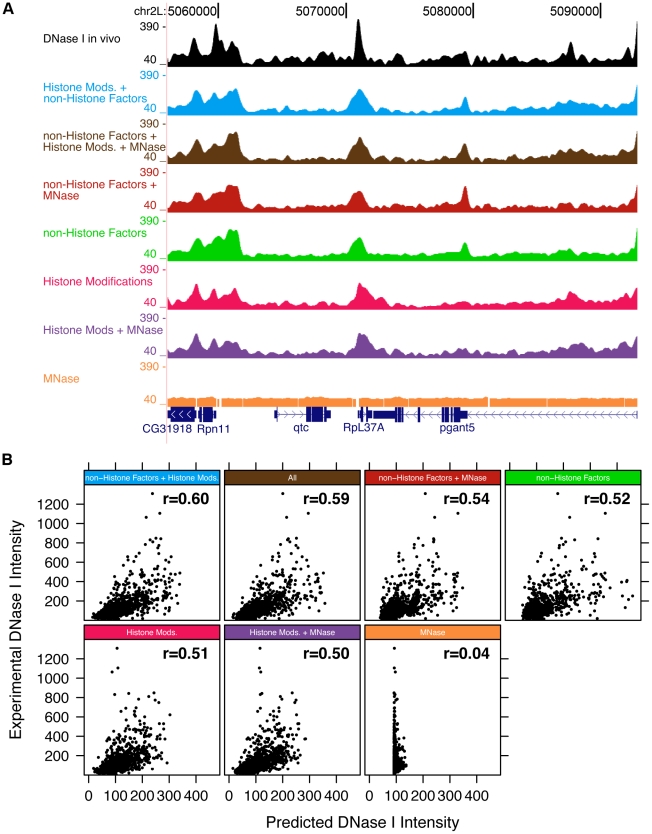
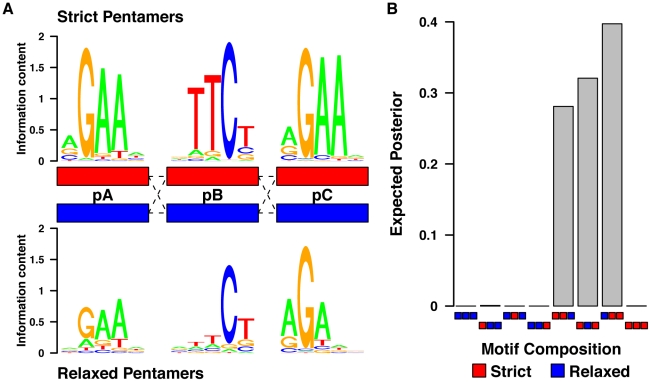
DNA sequence and local chromatin landscape act jointly to determine transcription factor (TF) binding intensity profiles. To disentangle these influences, we developed an experimental approach, called protein/DNA binding followed by high-throughput sequencing (PB-seq), that allows the binding energy landscape to be characterized genome-wide in the absence of chromatin. We applied our methods to the Drosophila Heat Shock Factor (HSF), which inducibly binds a target DNA sequence element (HSE) following heat shock stress. PB-seq involves incubating sheared naked genomic DNA with recombinant HSF, partitioning the HSF-bound and HSF-free DNA, and then detecting HSF-bound DNA by high-throughput sequencing. We compared PB-seq binding profiles with ones observed in vivo by ChIP-seq and developed statistical models to predict the observed departures from idealized binding patterns based on covariates describing the local chromatin environment. We found that DNase I hypersensitivity and tetra-acetylation of H4 were the most influential covariates in predicting changes in HSF binding affinity. We also investigated the extent to which DNA accessibility, as measured by digital DNase I footprinting data, could be predicted from MNase-seq data and the ChIP-chip profiles for many histone modifications and TFs, and found GAGA element associated factor (GAF), tetra-acetylation of H4, and H4K16 acetylation to be the most predictive covariates. Lastly, we generated an unbiased model of HSF binding sequences, which revealed distinct biophysical properties of the HSF/HSE interaction and a previously unrecognized substructure within the HSE. These findings provide new insights into the interplay between the genomic sequence and the chromatin landscape in determining transcription factor binding intensity.


Conflict of interest statement

The authors have declared that no competing interests exist.

Figures

Figure 1
Figure 1. In vitro binding reveals potential HSF binding sites.
The blue box highlights strong differences in the usage of potential binding sites in vivo at the Cpr67B locus, while the green boxes highlight differences in the magnitude of binding to major heat shock genes promoters, despite comparable in vitro binding affinities.
Figure 2
Figure 2. Recombinant HSF binds HSEs with picomolar affinity in vitro.
A and B) The mobility of the constant 200 attomole HSE probe shifts into a trimeric-HSF:HSE complex as increasing HSF is added. There is no HSF in the left-most lane, the right-most lane contains 3 nM HSF (1 nM trimeric HSF), and the intervening lanes contain two-fold serial dilutions of HSF. C) A hyperbolic curve based on the Kd equation (see Methods) was modeled using the band shift data, indicating a Kd of 42.6 pM (95% confidence interval of 36.8–49.4 pM). D) A hyperbolic curve based on the Kd equation (see Methods) was modeled using the band shift data, indicating a Kd of 224 pM (95% confidence interval of 181–276 pM). E) The intensity of each isolated HSE in the Drosophila genome is transformed to an absolute Kd using the absolute Kds calculated from band shift data in panels A and B. The Kd values range from 40–400 pM.
Figure 3
Figure 3. In vitro and in vivo binding of HSF to genomic HSEs do not correlate.
A) A scatter plot comparing the observed in vivo HSF binding intensity and in vitro binding intensity for each isolated HSE indicates that the vast majority of in vivo binding is suppressed (green) or abolished (blue), if we assume that the top seven most DNase I hypersensitive isolated HSE clusters provide the best estimates for sites that are minimally influenced by chromatin. After scaling, red points have similar in vivo and in vitro intensity, black points may be enhanced in vivo, while green and blue points are suppressed and abolished, respectively. B) The points from panel A were categorized, and the resulting bar chart shows the relative frequencies of each category.
Figure 4
Figure 4. Genomic chromatin and PB–seq data accurately predict in vivo HSF binding intensity.
A) The intensity of in vivo ChIP-seq peaks is not recapitulated by in vitro PB–seq data; however, genomic DNase I hypersensitivity data and histone modification ChIP-chip data can be used to accurately predict HSF binding intensity. B) The experimentally determined ratio between in vivo ChIP-seq HSF intensity and in vitro PB–seq intensity is plotted against the predicted in vivo/actual PB–seq ratio. The Pearson correlation for each model is shown.
Figure 5
Figure 5. Histone acetylation and GAF occupancy are important covariates in predicting HSF binding intensity.
Plotted are the relative values of the sums of the coefficients associated with all rules that reference each covariate in the rules ensemble . Results are shown for (A) the histone variant and modification model and (B) the non-Histone factor model.
Figure 6
Figure 6. DNase I hypersensitivity can be inferred using histone marks and MNase data.
A) The intensity of DNase I hypersensitivity landscape is inferred by models (colors) that use histone modification profiles, non-histone factor profiles, DNase I data and MNase-seq data. B) The experimentally determined DNase I hypersensitivity data is plotted against inferred intensity for the various models. The Pearson correlation for each model is shown.
Figure 7
Figure 7. Pentamers within the HSEs are dependent upon their consensus match and also their position relative to the other pentamers.
A) The mixture model defines each pentamer within the HSE as strict or relaxed depending upon how well it conforms to the canonical HSE. Note that the position of relaxed pentamers strongly influences their composition. B) A probabilistic sequence model reveals that the presence of two strict (red) and one relaxed (blue) pentamer provides the best explanation of the data.

References

    1. Field Y, Sharon E, Segal E. How transcription factors identify regulatory sites in genomic sequence. Subcell Biochem. 2011;52:193–204. - PubMed
    1. Berger MF, Bulyk ML. Universal protein-binding microarrays for the comprehensive characterization of the DNA-binding specificities of transcription factors. Nat Protoc. 2009;4:393–411. - PMC - PubMed
    1. Liu J, Stormo GD. Combining SELEX with quantitative assays to rapidly obtain accurate models of protein-DNA interactions. Nucleic Acids Res. 2005;33:e141. - PMC - PubMed
    1. Hesselberth JR, Chen X, Zhang Z, Sabo PJ, Sandstrom R, et al. Global mapping of protein-DNA interactions in vivo by digital genomic footprinting. Nat Methods. 2009;6:283–289. - PMC - PubMed
    1. Liu X, Noll DM, Lieb JD, Clarke ND. DIP-chip: Rapid and accurate determination of DNA-binding specificity. Genome Res. 2005;15:421–427. - PMC - PubMed

Publication types

MeSH terms