. 2012;8(3):e1002612.
doi: 10.1371/journal.pgen.1002612. Epub 2012 Mar 29.

Metabolic profiling of a mapping population exposes new insights in the regulation of seed metabolism and seed, fruit, and plant relations

Affiliations

Metabolic profiling of a mapping population exposes new insights in the regulation of seed metabolism and seed, fruit, and plant relations

David Toubiana et al. PLoS Genet. 2012.

Abstract

To investigate the regulation of seed metabolism and to estimate the degree of metabolic natural variability, metabolite profiling and network analysis were applied to a collection of 76 different homozygous tomato introgression lines (ILs) grown in the field in two consecutive harvest seasons. Factorial ANOVA confirmed the presence of 30 metabolite quantitative trait loci (mQTL). Amino acid contents displayed a high degree of variability across the population, with similar patterns across the two seasons, while sugars exhibited significant seasonal fluctuations. Upon integration of data for tomato pericarp metabolite profiling, factorial ANOVA identified the main factor for metabolic polymorphism to be the genotypic background rather than the environment or the tissue. Analysis of the coefficient of variance indicated greater phenotypic plasticity in the ILs than in the M82 tomato cultivar. Broad-sense estimate of heritability suggested that the mode of inheritance of metabolite traits in the seed differed from that in the fruit. Correlation-based metabolic network analysis comparing metabolite data for the seed with that for the pericarp showed that the seed network displayed tighter interdependence of metabolic processes than the fruit. Amino acids in the seed metabolic network were shown to play a central hub-like role in the topology of the network, maintaining high interactions with other metabolite categories, i.e., sugars and organic acids. Network analysis identified six exceptionally highly co-regulated amino acids, Gly, Ser, Thr, Ile, Val, and Pro. The strong interdependence of this group was confirmed by the mQTL mapping. Taken together these results (i) reflect the extensive redundancy of the regulation underlying seed metabolism, (ii) demonstrate the tight co-ordination of seed metabolism with respect to fruit metabolism, and (iii) emphasize the centrality of the amino acid module in the seed metabolic network. Finally, the study highlights the added value of integrating metabolic network analysis with mQTL mapping.


Conflict of interest statement

The authors have declared that no competing interests exist.

Figures

Figure 1
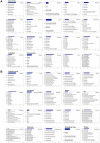
Figure 1. Heat map of metabolites measured across the IL collection during season I.
Heat map representation of changes in metabolite levels measured on dry IL seeds of harvest season I in Akko, Israel. Significance of fold change with respect to cultivar M82 (control) was evaluated by Dunnett's test. Blue rectangles indicate a significant decrease in metabolite content, and red rectangles, a significant increase in metabolite content. Pink areas indicate a non-significant change of metabolic concentrations. Metabolites were categorized according to their compound class. A mirror heat map of significance values is given in Figure S1. Groups of metabolites for which changes were highly significant (p<0.001) are delimited within black rectangles and magnified outside the heat map.
Figure 2
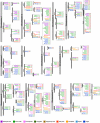
Figure 2. Significant metabolites identified for different ILs in season I.
Bar graph representation of significant metabolites identified by Dunnett's-test (p-value<0.05 – after Bonferroni correction) as applied to dry IL seeds of harvest season I in Akko, Israel, in comparison with the control M82. Each bar graph depicts a single metabolite and fold change as compared to M82. Control (M82) levels are shown in dark blue. Metabolites are categorized according to their compound class.
Figure 3
Figure 3. Mapping of significant changes in metabolite content onto introgressed segments.
Visualization of significant changes as compared to M82 as identified by Dunnett's test applied to IL season I harvest in Akko, Israel. The chromosomes and the site of introgression are schematically presented with the associated metabolites. Only metabolites exhibiting a significant difference from the control value (p-value<0.05, after the Bonferroni correction) are shown. Values next to metabolites indicate a positive (green) or negative (red), respectively, change in comparison with the value for the control M82. Each value is based on a fold change, e.g., glycolate on IL1-1-2 indicates a +1.2 significant increase = (control) 1+1.2 = 2.2 higher content of glycolate in IL 1-1-2 than in the control M82. Metabolites were categorized according to their compound class (see color key on the Figure).
Figure 4
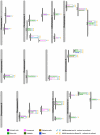
Figure 4. mQTL map of shared significant changes over seasons I and II.
GC-MS measurements were performed for consecutive seasons I and II in Akko, Israel; metabolic concentrations were measured in dry seeds. The putative mQTL and their associated metabolites are depicted in the Figure. Symbols next to putative mQTL indicate results of pairwise 2-way ANOVA for each metabolite across the seasons of matching ILs. Blue symbols refer to the single term – genotype; yellow symbols refer to the interaction term – season * genotype. Blue and yellow ticks indicate confirmed by single or interaction term, respectively; blue and yellow crosses indicate not confirmed by single or interaction term, respectively.
Figure 5
Figure 5. Tests of heritability as estimated on a tomato seed and fruit IL population.
Coefficient of variation (CV) values were calculated by taking the ratio of the standard deviation over the mean for every metabolite individually for each IL and M82. Thereafter, the resulting CV values were divided into 40 bins of incrementing intervals of 0.1, for which the relative frequencies in the wild type and the ILs were estimated in both the fruit and in the seed (panel a). Broad-sense heritability (H2) values were calculated for all metabolites on the background of the seed and fruit IL population across two and three seasons, respectively. Values of H2 were divided into bins of 0.1 intervals. Bar graphs represent the total number for each respective bin on the background of the seed and fruit population (panel b). For exact estimation of H2 values see Methods and Materials.
Figure 6
Figure 6. Morphological traits—metabolite correlation/significance.
Correlation between metabolic data as analyzed on dry IL seeds of harvest season I in Akko, Israel and the ILs' morphological traits. The Pearson product-moment correlation was used to calculate all pairwise correlations between morphological traits and metabolites heading the rows and morphological traits and metabolites heading the columns. In the colored area, rectangles represent r values resulting from Pearson correlation coefficient computation (see correlation color key). In the black and white area, rectangles represent p-values respective to Pearson correlation coefficient (see Significance color key). Z-score transformation was employed to enable correlation computation. X and Y-axes are categorized into morphological traits and metabolites, grouped by compound classes.
Figure 7
Figure 7. Seed-fruit metabolite network.
Network visualization of metabolites as analyzed on dry IL seed and fruit metabolites of harvest season I in Akko, Israel. Metabolites are represented as nodes, and their relations, as edges. The Pearson product-moment correlation was employed to compute all pairwise correlations between metabolites across the entire set of ILs. Only significant correlations are depicted. A significance level of ≤0.01 and an r-value of ≥0.3 were considered to be significant. Seed metabolites are depicted as circular black-bordered nodes, fruit metabolites are depicted as diamond-shaped red-bordered nodes. Metabolites are color coded and clustered according to their compound classes. The two tissue sub-networks are separated spatially into the left region (seed network) and right region (fruit network). Positive correlations are denoted as blue edges, and negative correlations are denoted as red edges. Computations of the correlations were conducted under the R environment. Cytoscape was used to generate the graphical output of the networks.
Figure 8
Figure 8. Degree of connectivity cluster network.
Network visualization of metabolites as analyzed on dry seed and the fruit of IL season I harvest in Akko, Israel. Metabolites are presented as nodes, and their relations, as edges. The Pearson product-moment correlation was employed to compute all pairwise correlations across the entire set of ILs. Only significant correlations are shown. Clusters of high connectivity of metabolites were generated on the basis of the network presented in Figure 7 by applying the clustering algorithm supplied by the NeMo for Cytoscape plug-in. Metabolites were clustered together on the basis of the degree of connectivity to adjacent metabolites. The two main clusters (seed-fruit) were verified by computing the modularity value Q by using the fast greedy community algorithm under the R environment. Seed metabolites are depicted as circular black-bordered nodes, and fruit metabolites are depicted as diamond-shaped red-bordered nodes. Positive correlations are denoted as blue edges, and negative correlations, as red edges. Computations of the correlations were conducted under the R environment. Cytoscape was used to generate the graphical output of network.
Figure 9
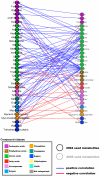
Figure 9. Bipartite cross-seasonal correlation network.
Bipartite cross-seasonal network visualization of metabolites as analyzed on dry IL seeds of harvest seasons I and II in Akko, Israel. Metabolites were correlated employing Pearson's correlation coefficient among seasons and ordered according to their compound classes. Nodes represent metabolites of harvest seasons I and II, respectively. Edges represent significant correlations across seasons among metabolites. Blue edges depict positive correlation, and red edges, negative correlations. A significance level of ≤0.01 and an r-value of ≥0.3 were considered to be significant. Computations of the correlations were conducted under the R environment. Cytoscape was used to generate the graphical output of the network.

References

    1. Liu JP, Cong B, Tanksley SD. Generation and analysis of an artificial gene dosage series in tomato to study the mechanisms by which the cloned quantitative trait locus fw2.2 controls fruit size. Plant Physiol. 2003;132:292–299. - PMC - PubMed
    1. Schauer N, Semel Y, Roessner U, Gur A, Balbo I, et al. Comprehensive metabolic profiling and phenotyping of interspecific introgression lines for tomato improvement. Nat Biotechnol. 2006;24:447–454. - PubMed
    1. Moftah AE, Al-Redhaiman KN. Effects of preharvest foliar spray of ‘Limewash’ on water relations, quantity, quality, and shelf life of bell pepper under water deficit conditions. Eur J Hortic Sci. 2006;71:78–83.
    1. Gilbert L, Alhagdow M, Nunes-Nesi A, Quemener B, Guillon F, et al. GDP-d-mannose 3,5-epimerase (GME) plays a key role at the intersection of ascorbate and non-cellulosic cell-wall biosynthesis in tomato. Plant J. 2009;60:499–508. - PubMed
    1. Maloney GS, Kochevenko A, Tieman DM, Tohge T, Krieger U, et al. Characterization of the Branched-Chain Amino Acid Aminotransferase Enzyme Family in Tomato. Plant Physiol. 2010;153:925–936. - PMC - PubMed

Publication types