. 2012;7(3):e33768.
doi: 10.1371/journal.pone.0033768. Epub 2012 Mar 29.

The transcriptome and proteome of the diatom Thalassiosira pseudonana reveal a diverse phosphorus stress response

Affiliations

The transcriptome and proteome of the diatom Thalassiosira pseudonana reveal a diverse phosphorus stress response

Sonya T Dyhrman et al. PLoS One. 2012.

Abstract

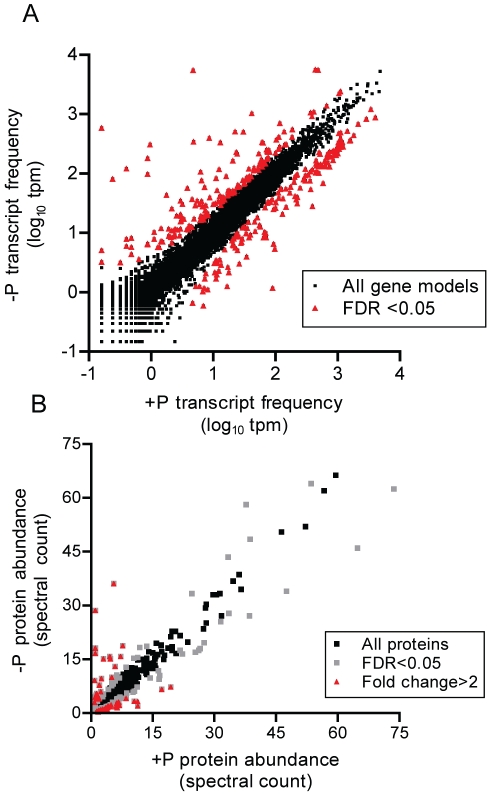
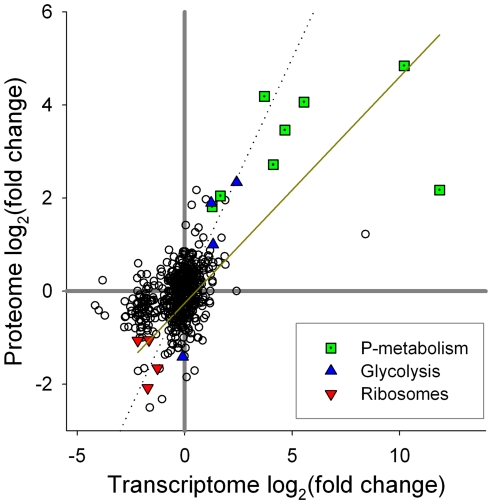
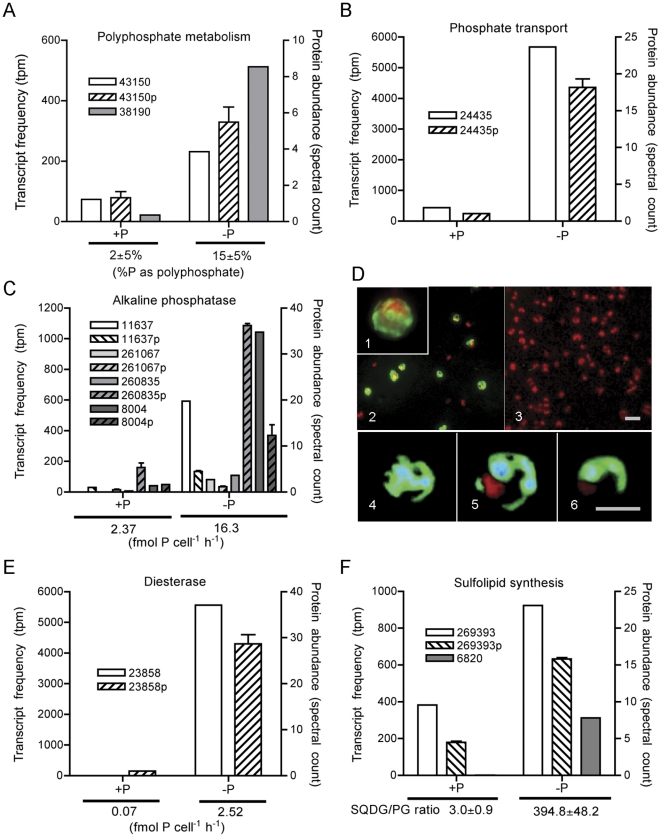
Phosphorus (P) is a critical driver of phytoplankton growth and ecosystem function in the ocean. Diatoms are an abundant class of marine phytoplankton that are responsible for significant amounts of primary production. With the control they exert on the oceanic carbon cycle, there have been a number of studies focused on how diatoms respond to limiting macro and micronutrients such as iron and nitrogen. However, diatom physiological responses to P deficiency are poorly understood. Here, we couple deep sequencing of transcript tags and quantitative proteomics to analyze the diatom Thalassiosira pseudonana grown under P-replete and P-deficient conditions. A total of 318 transcripts were differentially regulated with a false discovery rate of <0.05, and a total of 136 proteins were differentially abundant (p<0.05). Significant changes in the abundance of transcripts and proteins were observed and coordinated for multiple biochemical pathways, including glycolysis and translation. Patterns in transcript and protein abundance were also linked to physiological changes in cellular P distributions, and enzyme activities. These data demonstrate that diatom P deficiency results in changes in cellular P allocation through polyphosphate production, increased P transport, a switch to utilization of dissolved organic P through increased production of metalloenzymes, and a remodeling of the cell surface through production of sulfolipids. Together, these findings reveal that T. pseudonana has evolved a sophisticated response to P deficiency involving multiple biochemical strategies that are likely critical to its ability to respond to variations in environmental P availability.


Conflict of interest statement

Competing Interests: The authors have declared that no competing interests exist.

Figures

Figure 1
Figure 1. Phosphorus deficiency signals in the transcriptome and proteome.
Global quantitative transcriptomic (A) and proteomic (B) analyses of T. pseudonana comparing P-replete (+P) and P-deficient (-P) treatments. Each data point represents a unique gene model (A) or protein (B), with those that are significantly differentially regulated noted in color. For the transcriptome data, tags mapped to a gene model were summed and then the total count was normalized to library size in tags per million (tpm). FDR is the false discovery rate p<0.05.
Figure 2
Figure 2. Comparison of transcript and protein signals.
Comparison of proteome and transcriptome changes in response to P deficiency. Fold-change presented as the log2 of the ratio of deficient∶replete conditions. Unity lines are shown in grey solid (fold-change = 1), while a linear regression (log2[proteins] = 0.49*log2[transcripts]-0.25) of proteins that are >2-fold in abundance in either treatment against their corresponding transcripts is shown in yellow (r2 = 0.53). The dashed line is the 1∶1 line denoting equal fold change between the deficient and replete conditions for the transcriptome and the proteome. Proteins and transcripts of interest that correspond to P-metabolism, glycolysis and ribosomes/translation are highlighted.
Figure 3
Figure 3. Transcript, protein, and physiological parameters linked to phosphorus deficiency.
Normalized transcript and protein abundance for significantly differentially regulated signatures and their associated physiological patterns, for polyphosphate metabolism (A), phosphate transport (B), alkaline phosphatase (C, D), phosphodiesterase (E), and sulfolipid synthesis (F) across P-replete (+P) and P-deficient (-P) conditions. Protein data are distinguished with a “p” next to the PID and by the hatched pattern. Polyphosphate abundances as measured by solid state 31P NMR (A) and enzyme activities (C, E), were assayed and are reported below each graph. Cell-associated alkaline phosphatase activity (green color) was detected using an enzyme labeled fluorescence substrate. The green fluorescence indicating enzyme activity is present in -P cells (panels 1, 2, 4, 5, and 6) and not present in +P cells (panel 3) (D). Chlorophyll autofluorescence (red) in also visible. Panels 4, 5, and 6 are a Z series through a labeled –P cell. The SQDG:PC ratio is reported from Van Mooy et al. (2009) from replete and P-deficient T. pseudonana cultures , which were grown similarly to those in this study. SQDG: sulphoquinovosyldiacylglyerol; PG: phosphatidylglycerol.

References

    1. Dyhrman ST, Ammerman JW, Van Mooy BAS. Microbes and the Marine Phosphorus Cycle. Oceanography. 2007;20:110–116.
    1. Coleman ML, Chisholm SW. Ecosystem-specific selection pressures revealed through comparative population genomics. Proc Nat Acad Sci. 2010;107:18634–18639. - PMC - PubMed
    1. Benitez-Nelson CR. The biogeochemical cycling of phosphorus in marine systems. Erth-Sci Rev. 2000;51:109–135.
    1. Nelson DM, Treguer P, Brzezinski MA, Leynaert A, Queguiner B. Production and dissolution of biogenic silica in the ocean - revised global estimates, comparison with regional data and relationship to biogenic sedimentation. Global Biogeochem Cy. 1995;9:359–372.
    1. Lomas MW, Burke AL, Lomas DA, Bell DW, Shen C, et al. Sargasso Sea phosphorus biogeochemistry: an important role for dissolved organic phosphorus (DOP). Biogeosciences. 2010;7:695–710.

Publication types