. 2012;7(3):e33948.
doi: 10.1371/journal.pone.0033948. Epub 2012 Mar 30.

Impact of multi-targeted antiretroviral treatment on gut T cell depletion and HIV reservoir seeding during acute HIV infection

Collaborators, Affiliations

Impact of multi-targeted antiretroviral treatment on gut T cell depletion and HIV reservoir seeding during acute HIV infection

Jintanat Ananworanich et al. PLoS One. 2012.

Abstract

Background: Limited knowledge exists on early HIV events that may inform preventive and therapeutic strategies. This study aims to characterize the earliest immunologic and virologic HIV events following infection and investigates the usage of a novel therapeutic strategy.

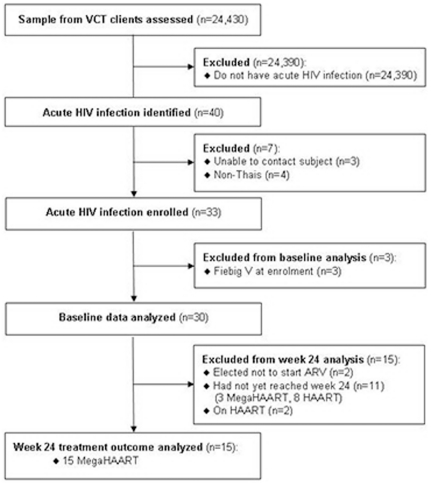
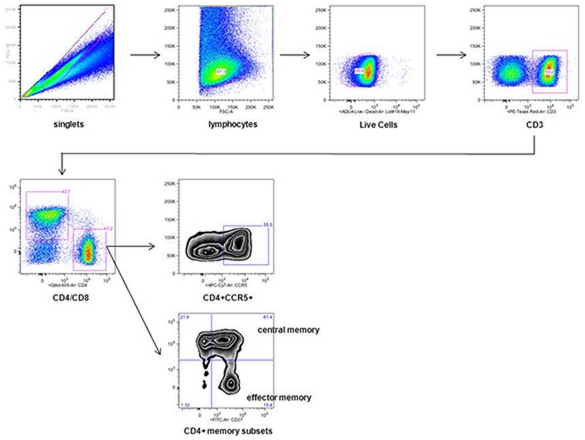
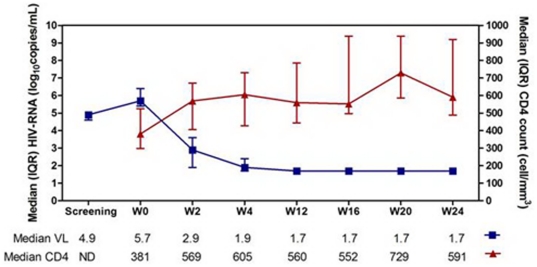
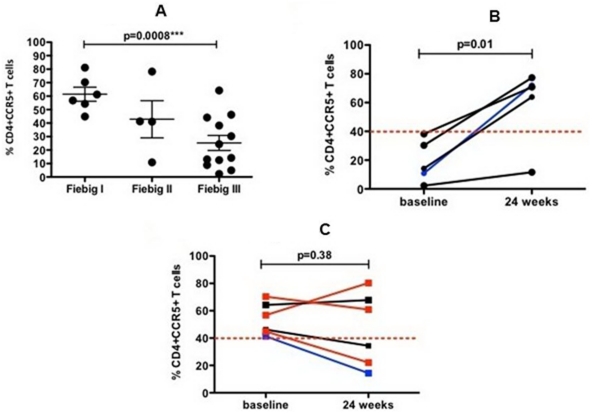
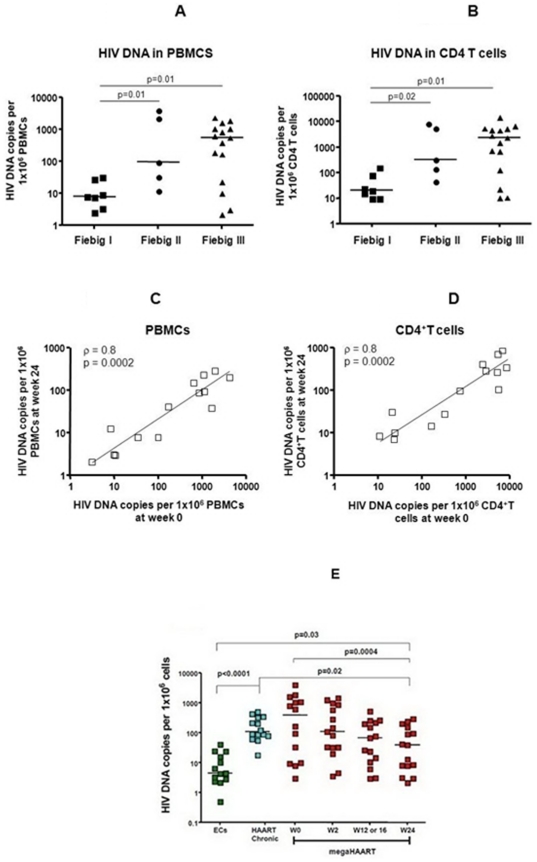
Methods and findings: We prospectively screened 24,430 subjects in Bangkok and identified 40 AHI individuals. Thirty Thais were enrolled (8 Fiebig I, 5 Fiebig II, 15 Fiebig III, 2 Fiebig IV) of whom 15 completed 24 weeks of megaHAART (tenofovir/emtricitabine/efavirenz/raltegravir/maraviroc). Sigmoid biopsies were completed in 24/30 at baseline and 13/15 at week 24. At baseline, the median age was 29 years and 83% were MSM. Most were symptomatic (87%), and were infected with R5-tropic (77%) CRF01_AE (70%). Median CD4 was 406 cells/mm(3). HIV RNA was 5.5 log(10) copies/ml. Median total blood HIV DNA was higher in Fiebig III (550 copy/10(6) PBMC) vs. Fiebig I (8 copy/10(6) PBMC) (p = 0.01) while the median %CD4+CCR5+ gut T cells was lower in Fiebig III (19%) vs. Fiebig I (59%) (p = 0.0008). After 24 weeks of megaHAART, HIV RNA levels of <50 copies were achieved in 14/15 in blood and 13/13 in gut. Total blood HIV DNA at week 0 predicted reservoir size at week 24 (p<0.001). Total HIV DNA declined significantly and was undetectable in 3 of 15 in blood and 3 of 7 in gut. Frequency of CD4+CCR5+ gut T cells increased from 41% at baseline to 64% at week 24 (p>0.050); subjects with less than 40% at baseline had a significant increase in CD4+CCR5+ T cells from baseline to week 24 (14% vs. 71%, p = 0.02).

Conclusions: Gut T cell depletion and HIV reservoir seeding increases with progression of AHI. MegaHAART was associated with immune restoration and reduced reservoir size. Our findings could inform research on strategies to achieve HIV drug-free remission.


Conflict of interest statement

Competing Interests: JA has received speaker's fee and/or honorarium from Abbott, Gilead and ViiV. There are no patents, products in development or marketed products to declare. This does not alter the authors' adherence to all the PLoS ONE policies on sharing data and materials, as detailed online in the guide for authors.

Figures

Figure 1
Figure 1. Description of the patient disposition.
MegaHAART: Five antiretrovirals (ARVs) including tenofovir, emtricitabine, efavirenz, raltegravir and maraviroc.
Figure 2
Figure 2. Gating Strategy used to determine the frequency of CD4+CCR5+ T cells.
The gating strategy applied for mucosal mononuclear cells (MMC) and peripheral blood mononuclear cells is shown representative on a set of MMC. Initial gating used forward scatter height versus forward scatter area plot to exclude doublets, and forward scatter height versus a sideward scatter height plot to isolate lymphocytes. Dead cells were excluded by Aqua Live/Dead staining and subsequently CD3+ and CD4+ T cells were included. Frequencies of CCR5+ T cells are expressed as frequency of CD4 T cells. Effector memory (EM) T cells were defined as CD27− and CD45RO+ and central memory (CM) T cells as CD27+ and CD45RO+ CD4+ T cells.
Figure 3
Figure 3. Plasma HIV RNA and CD4 response to megaHAART.
The mean time from the screening visit to week 0 is 3 days (standard deviation 1.6 days).
Figure 4
Figure 4. Frequency of CD4+CCR5+ T cells in sigmoid colon in acute-HIV infected subjects.
In the sigmoid colon of acute HIV infection patients, the frequency of CD4+CCR5+ T cells declined significantly from Fiebig I (median: 53%) to Fiebig III (median: 19.3%) (p = 0.0008) ( Figure 4A ). After 24 weeks of megaHAART, the frequency of CD4+CCR5+ T cells was restored in patients with a baseline frequency below the median value of 40% ( Figure 4B ) while patients with a frequency above the median value of 40% at baseline showed a variable response to treatment ( Figure 4C ). For Figure 4A, each dot represents an individual subject with horizontal bars showing median values and interquartile ranges. For Figures 4B and 4C, each line represents changes of gut CD4+CCR5+ T cells from baseline to week 24 in an individual subject. Blue line – Fiebig I; black line – Fiebig II; red line – Fiebig III. Data from two Fiebig IV subjects were not included in the analysis.
Figure 5
Figure 5. HIV reservoir size by total HIV DNA quantification in peripheral blood mononuclear cells and CD4+ T cells of acute-HIV infected subjects.
Footnote: At baseline, the HIV reservoir size, determined by the frequencies of HIV-infected cells expressed as HIV DNA copies per million peripheral blood mononuclear cells (PBMCs) ( Figure 5A ) or calculated per million CD4+ T cells (based on CD4 frequency among PBMCs measured by flow cytometry) ( Figure 5B ), increased with progression of Fiebig stage. The amount of total HIV DNA in PBMCs ( Figure 5C ) and in CD4+ T cells ( Figure 5D ) at baseline predicted the HIV reservoir size after 24 weeks of antiretroviral treatment. The median total HIV DNA in PBMCs of subjects treated during acute HIV infection in this study was lower than that of subjects treated during chronic HIV infection. In addition, some acutely treated subjects achieved HIV DNA in PBMCs as low as that in elite controllers ( Figure 5E ). For all figures, each data point represents an individual subject. For figures 5A to 5D, the horizontal bars represent the median values. For figure 5E, megaHAART (highly active antiretroviral therapy) represents subjects in this study who initiated 5-drug antiretroviral regimen during acute HIV infection (n = 15). Data from two control groups are included here as HAART chronic and ECs (elite controllers). HAART chronic represents subjects who initiated standard antiretroviral therapy during the chronic HIV infection stage and had received treatment for a mean duration of 56 months (n = 14). Elite controllers represent subjects whom HIV RNA are undetectable in the absence of antiretroviral therapy (n = 13).
Figure 6
Figure 6. Decline in plasma cytokines following 24 weeks of antiretroviral treatment.
Interferon (IFN)-α ( Figure 6A ); interleukin (IL)-17 ( Figure 6B ); interferon gamma-induced protein (IP)-10 ( Figure 6C ). All cytokine levels were significantly reduced following treatment.
Figure 7
Figure 7. Inflammatory biomarkers following 24 weeks of antiretroviral treatment.
Lipopolysaccharide (LPS) ( Figure 7A ); C-reactive protein (CRP) ( Figure 7B ); soluble CD14 (sCD14) ( Figure 7C ); D-dimer ( Figure 7D ) and hyaluronic acid ( Figure 7E ). Only D-dimer levels were significantly reduced after treatment.

References

    1. Hutter G, Nowak D, Mossner M, Ganepola S, Mussig A, et al. Long-term control of HIV by CCR5 Delta32/Delta32 stem-cell transplantation. N Engl J Med. 2009;360:692–698. - PubMed
    1. Trono D, Van Lint C, Rouzioux C, Verdin E, Barre-Sinoussi F, et al. HIV persistence and the prospect of long-term drug-free remissions for HIV-infected individuals. Science. 2010;329:174–180. - PubMed
    1. Douek DC, Roederer M, Koup RA. Emerging concepts in the immunopathogenesis of AIDS. Annu Rev Med. 2009;60:471–484. - PMC - PubMed
    1. Hicks CB, Gay C, Ferrari G. Acute HIV infection: the impact of anti-retroviral treatment on cellular immune responses. Clin Exp Immunol. 2007;149:211–216. - PMC - PubMed
    1. McMichael AJ, Borrow P, Tomaras GD, Goonetilleke N, Haynes BF. The immune response during acute HIV-1 infection: clues for vaccine development. Nat Rev Immunol. 2010;10:11–23. - PMC - PubMed

Publication types

MeSH terms