. 2012;7(3):e34071.
doi: 10.1371/journal.pone.0034071. Epub 2012 Mar 30.

EGF-induced EMT and invasiveness in serous borderline ovarian tumor cells: a possible step in the transition to low-grade serous carcinoma cells?

Affiliations

EGF-induced EMT and invasiveness in serous borderline ovarian tumor cells: a possible step in the transition to low-grade serous carcinoma cells?

Jung-Chien Cheng et al. PLoS One. 2012.

Abstract

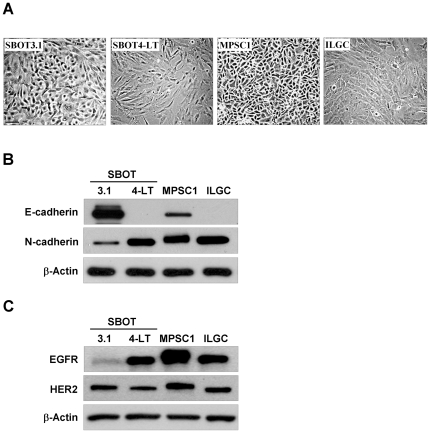
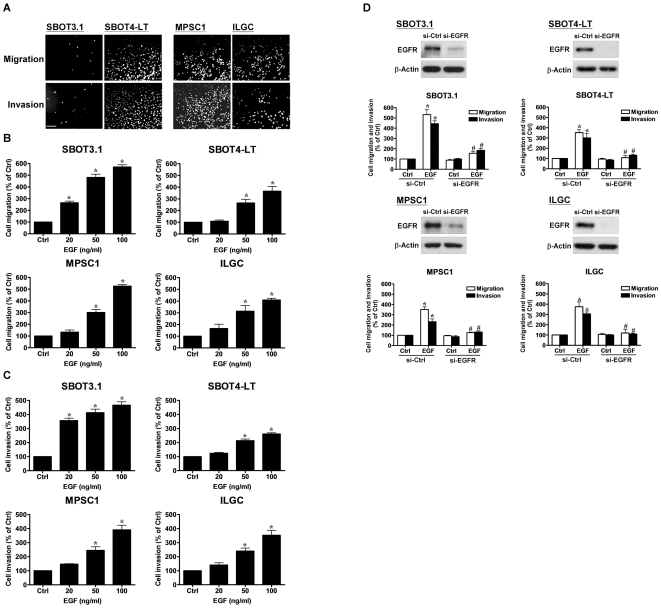
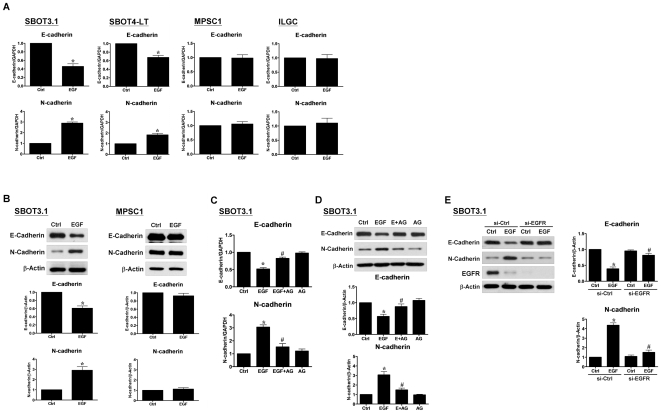
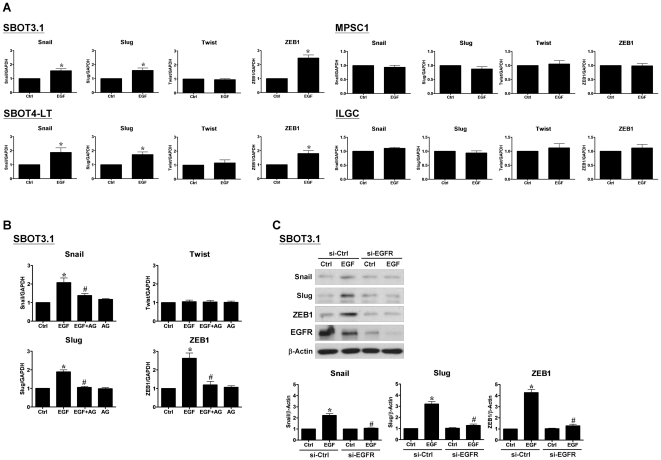
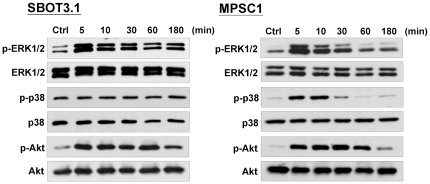
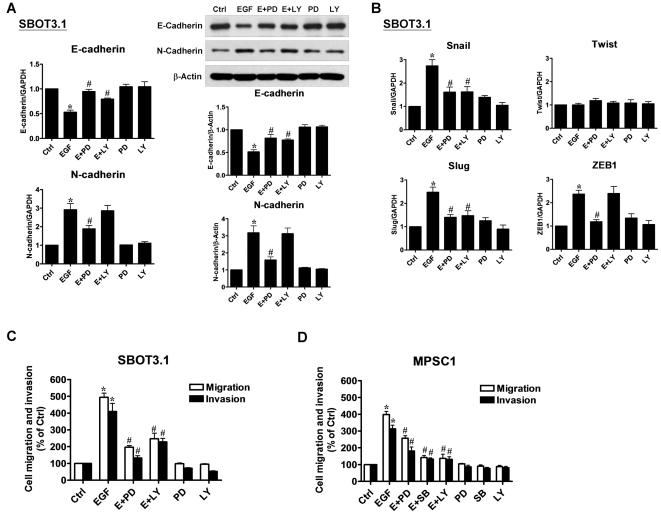
In high-grade ovarian cancer cultures, it has been shown that epidermal growth factor (EGF) induces cell invasion by activating an epithelial-mesenchymal transition (EMT). However, the effect of EGF on serous borderline ovarian tumors (SBOT) and low-grade serous carcinomas (LGC) cell invasion remains unknown. Here, we show that EGF receptor (EGFR) was expressed, that EGF treatment increased cell migration and invasion in two cultured SBOT cell lines, SBOT3.1 and SV40 large T antigen-infected SBOT cells (SBOT4-LT), and in two cultured LGC cell lines, MPSC1 and SV40 LT/ST-immortalized LGC cells (ILGC). However, EGF induced down-regulation of E-cadherin and concurrent up-regulation of N-cadherin in SBOT cells but not in LGC cells. In SBOT cells, the expression of the transcriptional repressors of E-cadherin, Snail, Slug and ZEB1 were increased by EGF treatment. Treatment with EGF led to the activation of the downstream ERK1/2 and PI3K/Akt. The MEK1 inhibitor PD98059 diminished the EGF-induced cadherin switch and the up-regulation of Snail, Slug and ZEB1 and the EGF-mediated increase in SBOT cell migration and invasion. The PI3K inhibitor LY294002 had similar effects, but it could not block the EGF-induced up-regulation of N-cadherin and ZEB1. This study demonstrates that EGF induces SBOT cell migration and invasion by activating EMT, which involves the activation of the ERK1/2 and PI3K/Akt pathways and, subsequently, Snail, Slug and ZEB1 expression. Moreover, our results suggest that there are EMT-independent mechanisms that mediate the EGF-induced LGC cell migration and invasion.


Conflict of interest statement

Competing Interests: The authors have declared that no competing interests exist.

Figures

Figure 1
Figure 1. Expression of E-cadherin, N-cadherin, EGFR and HER2 in SBOT3.1, SBOT4-LT, MPSC1 and ILGC cells.
A, The morphology of SBOT3.1, SBOT4-LT, MPSC1 and ILGC cells. The scale bar represents 100 µm. B, Endogenous protein levels of E-cadherin and N-cadherin were analyzed by western blot. C, Endogenous protein levels of EGFR and HER2 were analyzed by western blot.
Figure 2
Figure 2. EGF induces cell migration and invasion in SBOT3.1, SBOT4-LT, MPSC1 and ILGC cells.
A, The intrinsic migration and invasion of cells. B and C, Cells were treated with increasing doses of EGF (20, 50 and 100 ng/ml). D, Cells were transfected with control siRNA (si-Ctrl) or EGFR siRNA (si-EGFR) for 48 hr and then treated with 50 ng/ml EGF. After treatment cells were seeded into un-coated (migration) and Matrigel-coated (invasion) transwell inserts. After 24 hr (migration) and 48 hr (invasion) incubation, non-invading cells were wiped from the upper side of the filter and the nuclei of invading cells were stained with Hoechst 33258. Top panels show representative photos of the migration or invasion assay. Scale bar represents 200 µm. Bottom panels show summarized quantitative results which are expressed as the mean ± SEM of at least three independent experiments. Western blots show the knockdown of EGFR by EGFR siRNA. *p<0.05 compared with Ctrl. #p<0.05 compared with EGF or EGF in si-Ctrl.
Figure 3
Figure 3. EGF induces cadherin switch in SBOT3.1 and SBOT4-LT cells, but not in MPSC1 and ILGC cells.
A, Cells were treated with 50 ng/ml EGF for 24 hr. E-cadherin and N-cadherin mRNA levels were analyzed by RT-qPCR. B, Cells were treated with 50 ng/ml EGF for 48 hr. E-cadherin and N-cadherin protein levels were analyzed by western blot. C and D, SBOT3.1 cells were treated with the EGFR inhibitor, AG1478 (10 µM), in the presence or absence of 50 ng/ml EGF, and the levels of E-cadherin and N-cadherin mRNA (24 hr EGF treatment) and protein (48 hr EGF treatment) were analyzed. E, SBOT3.1 cells were transfected with control siRNA (si-Ctrl) or EGFR siRNA (si-EGFR) for 48 hr and then treated with 50 ng/ml EGF for 48 hr. The protein levels of E-cadherin and N-cadherin were analyzed by western blot. The results are expressed as the mean ± SEM of at least three independent experiments. *p<0.05 compared with time-matched Ctrl. #p<0.05 compared with EGF or EGF in si-Ctrl.
Figure 4
Figure 4. EGF induces Snail, Slug and ZEB1 expression in SBOT3.1 and SBOT4-LT cells, but not in MPSC1 and ILGC cells.
A, Cells were treated with 50 ng/ml EGF for 24 hr, and the mRNA levels of Snail, Slug, Twist and ZEB1 were analyzed by RT-qPCR. B, SBOT3.1 cells were treated with AG1478 (10 µM) in the presence or absence of 50 ng/ml EGF for 24 hr, and mRNA levels were analyzed by RT-qPCR. C, SBOT3.1 cells were transfected with control siRNA (si-Ctrl) or EGFR siRNA (si-EGFR) for 48 hr and then treated with 50 ng/ml EGF for 48 hr. The protein levels of Snail, Slug and ZEB1 were analyzed by western blot. The results are expressed as the mean ± SEM of at least three independent experiments. *p<0.05 compared with Ctrl. #p<0.05 compared with EGF or EGF in si-Ctrl.
Figure 5
Figure 5. EGF activates ERK1/2 and Akt pathways in SBOT3.1 cells.
SBOT3.1 and MPSC1 cells were treated with 50 ng/ml EGF for the indicated durations. Phosphorylation of ERK1/2, p38 MAPK and Akt were determined by western blot using antibodies specific for phosphorylated, activated forms of ERK1/2 (p-ERK1/2), p38 MAPK (p-p38) and Akt (p-Akt). Membranes were stripped and reprobed with antibodies to total ERK1/2, p38 MAPK and Akt.
Figure 6
Figure 6. EGF induces cadherin switch through ERK1/2 and Akt activation in SBOT3.1 cells.
A, SBOT3.1 cells were treated for 48 hr with PD98059 (20 µM) or LY294002 (20 µM) in the presence or absence of 50 ng/ml EGF. E-cadherin and N-cadherin mRNA (left panel) and protein (right panel) levels were analyzed by RT-qPCR and western blot, respectively. B, SBOT3.1 cells were treated for with PD98059 (20 µM) or LY294002 (20 µM) in the presence or absence of 50 ng/ml EGF and Snail, and the Slug, Twist and ZEB1 mRNA levels were analyzed by RT-qPCR. C, SBOT3.1 cells were treated with 50 ng/ml EGF in combination with PD98059 (20 µM) or LY294002 (20 µM). D, MPSC1 cells were treated with 50 ng/ml EGF in combination with PD98059 (20 µM) SB203580 (10 µM) or LY294002 (20 µM). After treatment, cells were seeded into un-coated (migration) and Matrigel-coated (invasion) transwell inserts. After 24 hr (migration) and 48 hr (invasion) incubation, non-invading cells were wiped from the upper side of the filter and the nuclei of invading cells were stained with Hoechst 33258. Results are expressed as the mean ± SEM of at least three independent experiments. *p<0.05 compared with Ctrl. #p<0.05 compared with EGF.

References

    1. Thiery JP. Epithelial-mesenchymal transitions in tumour progression. Nat Rev Cancer. 2002;2:442–454. - PubMed
    1. Lee JM, Dedhar S, Kalluri R, Thompson EW. The epithelial-mesenchymal transition: new insights in signaling, development, and disease. J Cell Biol. 2006;172:973–981. - PMC - PubMed
    1. Huber MA, Kraut N, Beug H. Molecular requirements for epithelial-mesenchymal transition during tumor progression. Curr Opin Cell Biol. 2005;17:548–558. - PubMed
    1. Tse JC, Kalluri R. Mechanisms of metastasis: epithelial-to-mesenchymal transition and contribution of tumor microenvironment. J Cell Biochem. 2007;101:816–829. - PubMed
    1. Hynes NE, Lane HA. ERBB receptors and cancer: the complexity of targeted inhibitors. Nat Rev Cancer. 2005;5:341–354. - PubMed

Publication types

MeSH terms