. 2012;7(3):e34515.
doi: 10.1371/journal.pone.0034515. Epub 2012 Mar 29.

Network analysis of epidermal growth factor signaling using integrated genomic, proteomic and phosphorylation data

Affiliations

Network analysis of epidermal growth factor signaling using integrated genomic, proteomic and phosphorylation data

Katrina M Waters et al. PLoS One. 2012.

Abstract

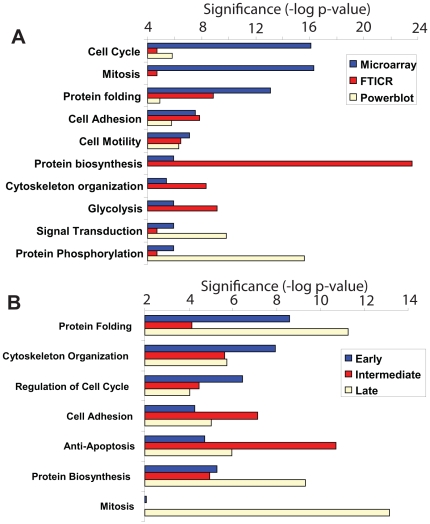
To understand how integration of multiple data types can help decipher cellular responses at the systems level, we analyzed the mitogenic response of human mammary epithelial cells to epidermal growth factor (EGF) using whole genome microarrays, mass spectrometry-based proteomics and large-scale western blots with over 1000 antibodies. A time course analysis revealed significant differences in the expression of 3172 genes and 596 proteins, including protein phosphorylation changes measured by western blot. Integration of these disparate data types showed that each contributed qualitatively different components to the observed cell response to EGF and that varying degrees of concordance in gene expression and protein abundance measurements could be linked to specific biological processes. Networks inferred from individual data types were relatively limited, whereas networks derived from the integrated data recapitulated the known major cellular responses to EGF and exhibited more highly connected signaling nodes than networks derived from any individual dataset. While cell cycle regulatory pathways were altered as anticipated, we found the most robust response to mitogenic concentrations of EGF was induction of matrix metalloprotease cascades, highlighting the importance of the EGFR system as a regulator of the extracellular environment. These results demonstrate the value of integrating multiple levels of biological information to more accurately reconstruct networks of cellular response.


Conflict of interest statement

Competing Interests: The authors have declared that no competing interests exist.

Figures

Figure 1
Figure 1. Experimental design and characterization of cell cycle transition with EGF treatment.
A) Experiments were scaled to provide sufficient sample for parallel analyses by gene microarray, global proteomics and Western blot technologies. B) Flow cytometry results showing the time course for transitions between G1/S and G2/M phases during EGF-induced mitosis.
Figure 2
Figure 2. Hierarchical cluster analyses showing temporal changes in expression ratios for significant RNA and protein changes.
The scale bar indicates the log10 expression ratio compared to 0 hr controls. Values in gray indicate the protein/phosphorylated protein was not detected at that time point.
Figure 3
Figure 3. K-means cluster analysis comparison of microarray and LC-FTICR expression ratio data.
The left panel shows the overall results for 446 RNA/protein pairs expressed as the log10 ratio over 0 hr control samples. Panels A–C highlight 3 different clusters that show different overall temporal patterns between the RNA and protein data.
Figure 4
Figure 4. Canonical correlation analysis of RNA and protein temporal expression profiles.
A) Ranked canonical correlations between RNA expression and protein expression, compared with random permutations. Each gray line shows the computed canonical correlations for a single random permutation. The first observed canonical correlation exceeds all corresponding permuted values, and the second canonical correlation exceeds 99% of permuted values; both are considered statistically significant. B) Scatter plot of first canonical variable between RNA and protein expression for 199 gene/protein pairs with a correlation coefficient of 0.44.
Figure 5
Figure 5. Major cell processes represented by each high-dimensional dataset.
The biological processes represented by each data type across all time points (Panel A) were determined by gene set enrichment and significance values are p-values calculated within the MetaCore software. Only the cell processes showing the highest significance values are shown. The results in panel B show the major cell processes for all combined data, separated based on early (0–4 hr), intermediate (8–13 hr) or late (18–24 hr) time points after EGFR activation.
Figure 6
Figure 6. Example network inferred from the integrated datasets.
Shown is the overall structure of one of the largest network clusters identified from the combined microarray, LC-FTICR and Powerblot datasets from the 0–4 hr early time domain. A) The source of the data contributing to each element (node) in this network cluster is coded by color, and connections between elements (edges) were inferred from the literature using the MetaCore database. B) The cellular processes represented by each node in the network are coded by color, using the process categories from Figure 5.

References

    1. Aderem A. Systems biology: its practice and challenges. Cell. 2005;121:511–513. - PubMed
    1. Wiley HS, Shvartsman SY, Lauffenburger DA. Computational modeling of the EGF-receptor system: a paradigm for systems biology. Trends Cell Biol. 2003;13:43–50. - PubMed
    1. Nicholson JK, Holmes E, Lindon JC, Wilson ID. The challenges of modeling mammalian biocomplexity. Nat Biotechnol. 2004;22:1268–1274. - PubMed
    1. Schena M, Shalon D, Davis RW, Brown PO. Quantitative monitoring of gene expression patterns with a complementary DNA microarray. Science. 1995;270:467–470. - PubMed
    1. Hoheisel JD. Microarray technology: beyond transcript profiling and genotype analysis. Nat Rev Genet. 2006;7:200–210. - PubMed

Publication types

Substances