. 2012;7(3):e34594.
doi: 10.1371/journal.pone.0034594. Epub 2012 Mar 29.

Heterogeneity of inflammatory and cytokine networks in chronic plaque psoriasis

Affiliations

Heterogeneity of inflammatory and cytokine networks in chronic plaque psoriasis

William R Swindell et al. PLoS One. 2012.

Abstract

The clinical features of psoriasis, characterized by sharply demarcated scaly erythematous plaques, are typically so distinctive that a diagnosis can easily be made on these grounds alone. However, there is great variability in treatment response between individual patients, and this may reflect heterogeneity of inflammatory networks driving the disease. In this study, whole-genome transcriptional profiling was used to characterize inflammatory and cytokine networks in 62 lesional skin samples obtained from patients with stable chronic plaque psoriasis. We were able to stratify lesions according to their inflammatory gene expression signatures, identifying those associated with strong (37% of patients), moderate (39%) and weak inflammatory infiltrates (24%). Additionally, we identified differences in cytokine signatures with heightened cytokine-response patterns in one sub-group of lesions (IL-13-strong; 50%) and attenuation of these patterns in a second sub-group (IL-13-weak; 50%). These sub-groups correlated with the composition of the inflammatory infiltrate, but were only weakly associated with increased risk allele frequency at some psoriasis susceptibility loci (e.g., REL, TRAF3IP2 and NOS2). Our findings highlight variable points in the inflammatory and cytokine networks known to drive chronic plaque psoriasis. Such heterogeneous aspects may shape clinical course and treatment responses, and can provide avenues for development of personalized treatments.


Conflict of interest statement

Competing Interests: The authors have declared that no competing interests exist.

Figures

Figure 1
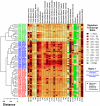
Figure 1. Sub-division of psoriasis lesions into strong, moderate and weak inflammatory groups based on genome-wide expression profiles.
The heatmap displays intensity of inflammatory gene expression patterns in psoriatic plaques obtained from 62 subjects (rows) with respect to 24 different cell types (columns; immunocytes and dermal cells). Strong inflammatory signatures are denoted by blue subject labels (23/62 subjects), moderate signatures by red labels (24/62) and weak signatures by green labels (15/62). Lesional (PP) and non-lesional (PN) skin from each subject was analyzed by microarray to identify PP-increased and PP-decreased transcripts. Chart colors denote the behavior of 1000 “signature transcripts” associated with each cell population (see scale and Methods). Percentage values (bottom) denote the total fraction of subjects with a significant bias towards PP-increased expression among signature transcripts (black dots). Subject labels include a patient identifier with sex (M or F) and age. Asterisk symbols denote subjects with IL-13-weak gene expression signatures (see text and Figure 2). An expanded version of this figure is provided as supplemental material (Figure S1).
Figure 2
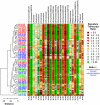
Figure 2. Sub-division of psoriasis lesions into IL-13-strong and IL-13-weak groups based on genome-wide expression profiles.
We identified 32 sets of 1000 cytokine-responsive transcripts based upon in vitro exposure of keratinocytes to cytokines. For each set (columns) and subject (rows), chart colors denote the ratio of PP-increased to PP-decreased transcripts (see scale and Methods). Up-triangles indicate significant bias towards PP-increased expression (FDR-adjusted P<0.05 and ratio value >1.50). Down-triangles indicate significant bias towards PP-decreased expression (FDR-adjusted P<0.05 and ratio value <0.667). Percentage values (bottom) denote the total fraction of subjects with significant patterns in either direction. Asterisk symbols identify subjects associated with the IL-13-weak group (bottom of dendrogram; 31/62 subjects). All other subjects are associated with IL-13-strong patterns (top of dendrogram; 31/62 subjects). Subject label colors are consistent with those in Figure 1 (strong, moderate and weak inflammatory groups). An expanded version of this figure is provided as supplemental material (Figure S7).
Figure 3
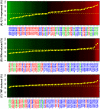
Figure 3. Distribution of IL-13, IFN-α and TNF gene expression signatures among lesional skin samples from 62 patients.
We identified sets of 1000 transcripts that were (A) repressed by IL-13 treatment of cultured keratinocytes, (B) induced by IFN-α treatment of keratinocytes and (C) induced by TNF treatment of keratinocytes. For each set and patient, we calculated the percentage of transcripts elevated in lesional (PP) samples as compared to paired non-lesional (PN) samples. In (A)–(C), subjects are ordered according to the estimated proportion of cytokine-responsive transcripts elevated in PP skin relative to PN skin. Yellow boxes outline a 95% confidence interval for this proportion. Label colors are consistent with those in Figure 1 (strong, moderate or weak inflammatory groups). Asterisk symbols identify subjects with IL-13-weak patterns (Figure 2).
Figure 4
Figure 4. Distribution of IL1-α, IL-17A and IFN-γ gene expression signatures among lesional skin samples from 62 patients.
We identified three sets of 1000 transcripts that were (A) induced by IL1-α treatment of cultured keratinocytes, (B) induced by IL-17A treatment of keratinocytes and (C) induced by IFN-γ treatment of keratinocytes. For each set and patient, we calculated the percentage of transcripts elevated in lesional (PP) samples as compared to paired non-lesional (PN) samples. In (A)–(C), subjects are ordered according to the estimated proportion of cytokine-responsive transcripts elevated in PP skin relative to PN skin (as described in the Figure 3 legend).

References

    1. Gudjonsson JE, Elder JT. Psoriasis. In: Wolff K, Goldsmith LA, Katz SI, Gilchrest BA, Paller AM, editors. Fitzpatrick's Dermatology in General Medicine. New York: McGraw-Hill; 2007. pp. 169–194.
    1. Balato N, Di Costanzo L, Balato A. Differential diagnosis of psoriasis. J Rheumatol. 2009;83:24–25. - PubMed
    1. Wendling D, Balblanc JC, Briançon D, Brousse A, Lohse A, et al. Onset or exacerbation of cutaneous psoriasis during TNFalpha antagonist therapy. Joint Bone Spine. 2008;75:315–318. - PubMed
    1. Viguier M, Richette P, Bachelez H, Wendling D, Aubin F. Paradoxical adverse effects of anti-TNF-alpha treatment: onset or exacerbation of cutaneous disorders. Expert Rev Clin Immunol. 2009;5:421–431. - PubMed
    1. Papp KA, Poulin Y, Bissonnette R, Bourcier M, Toth D, et al. Assessment of the long-term safety and effectiveness of etanercept for the treatment of psoriasis in an adult population. J Am Acad Dermatol. 2012;66:e33–e45. - PubMed

Publication types

MeSH terms