. 2011;12 Suppl 13(Suppl 13):S14.
doi: 10.1186/1471-2105-12-s13-s14. Epub 2011 Nov 30.

Network-based functional enrichment

Affiliations

Network-based functional enrichment

Christopher L Poirel et al. BMC Bioinformatics. 2011.

Abstract

Background: Many methods have been developed to infer and reason about molecular interaction networks. These approaches often yield networks with hundreds or thousands of nodes and up to an order of magnitude more edges. It is often desirable to summarize the biological information in such networks. A very common approach is to use gene function enrichment analysis for this task. A major drawback of this method is that it ignores information about the edges in the network being analyzed, i.e., it treats the network simply as a set of genes. In this paper, we introduce a novel method for functional enrichment that explicitly takes network interactions into account.

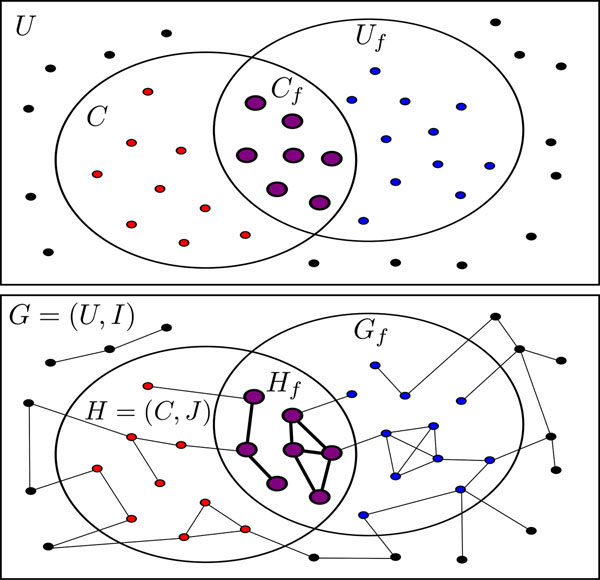
Results: Our approach naturally generalizes Fisher's exact test, a gene set-based technique. Given a function of interest, we compute the subgraph of the network induced by genes annotated to this function. We use the sequence of sizes of the connected components of this sub-network to estimate its connectivity. We estimate the statistical significance of the connectivity empirically by a permutation test. We present three applications of our method: i) determine which functions are enriched in a given network, ii) given a network and an interesting subnetwork of genes within that network, determine which functions are enriched in the sub-network, and iii) given two networks, determine the functions for which the connectivity improves when we merge the second network into the first. Through these applications, we show that our approach is a natural alternative to network clustering algorithms.

Conclusions: We presented a novel approach to functional enrichment that takes into account the pairwise relationships among genes annotated by a particular function. Each of the three applications discovers highly relevant functions. We used our methods to study biological data from three different organisms. Our results demonstrate the wide applicability of our methods. Our algorithms are implemented in C++ and are freely available under the GNU General Public License at our supplementary website. Additionally, all our input data andresults are available at http://bioinformatics.cs.vt.edu/~murali/supplements/2011-incob-nbe/.


Figures

Figure 1
Figure 1
Functional enrichment cartoons. (Top) The standard formulation of functional enrichment computes the statistical significance of the size of Cf, the overlap between an interesting collection C of genes and the set Uf of genes annotated with function f. (Bottom) Our network-based approach to functional enrichment computes the statistical significance of the connectivity of Hf, the network induced by the intersection of the interesting collection C and the set Uf of genes annotated by the function.
Figure 2
Figure 2
Functions related to B cells. Subgraphs of the BCI induced by genes annotated with (Top) GO:0065004 Protein-DNA Complex Assembly, (Middle) GO:0051251 Positive Regulation of Lymphocyte Activation, and (Bottom) GO:0006006 Glucose Metabolic Process. The red, blue, and green edges represent protein-protein, protein-DNA, and transcription factor-modulator interactions, respectively.
Figure 3
Figure 3
Functions related to hepatic cultures.Subgraphs of a hepatocyte response network induced by genes annotated with MSigDB gene sets. (Top Left) (KEGG) Regulation of Actin Cytoskeleton, (Top Right) (REACTOME) Cell Cycle Checkpoints, (Bottom Left) (REACTOME) Nuclear Receptor Transcription Pathway, and (Bottom Right) (KEGG) Drug Metabolism Cytochrome P450. Red and green nodes indicate up- and down-regulation, respectively, of individual genes in collagen sandwich versus hepatocyte monolayer tissue cultures. Darker node color indicates higher perturbation in either direction, as indicated by the legend on the left.
Figure 4
Figure 4
Functions related to the GI study. Subgraphs of the BioGRID universal network induced by genes annotated with GO biological processes (Left) GO:0001300 Chronological Cell Aging, (Middle) GO:0032392 DNA Geometric Change, and (Right) GO:0016575 Histone Deacetylation. Blue interactions are edges in BioGRID that were not identified by the GI study [22]. Solid pink edges were identified in the GI study and were also present in BioGRID through some alternative evidence. Dashed red interactions were only discovered by the GI study.

References

    1. Joshi-Tope G, Gillespie M, Vastrik I, D’Eustachio P, Schmidt E, de Bono B, Jassal B, Gopinath G, Wu G, Matthews L, Lewis S, Birney E, Stein L. Reactome: a knowledgebase of biological pathways. Nucleic Acids Res. 2005;33(Database issue):D428–32. - PMC - PubMed
    1. Reguly T, Breitkreutz A, Boucher L, Breitkreutz BJ, Hon GC, Myers CL, Parsons A, Friesen H, Oughtred R, Tong A, Stark C, Ho Y, Botstein D, Andrews B, Boone C, Troyanskya OG, Ideker T, Dolinski K, Batada NN, Tyers M. Comprehensive curation and analysis of global interaction networks in Saccharomyces cerevisiae. Journal of Biology. 2006;5(4):11+. doi: 10.1186/jbiol36. - DOI - PMC - PubMed
    1. Kanehisa M, Goto S, Hattori M, Aoki-Kinoshita KF, Itoh M, Kawashima S, Katayama T, Araki M, Hirakawa M. From genomics to chemical genomics: new developments in KEGG. Nucleic Acids Res. 2006;34(Database issue):D354–7. - PMC - PubMed
    1. Rual J. et al.Towards a proteome-scale map of the human protein-protein interaction network. Nature. 2005;437(7062):1173–8. doi: 10.1038/nature04209. - DOI - PubMed
    1. Uetz P, Giot L, Cagney G, Mansfield TA. et al.A comprehensive analysis of protein-protein interactions in Saccharomyces cerevisiae. Nature. 2000;403(6770):623–627. doi: 10.1038/35001009. - DOI - PubMed

Publication types

LinkOut - more resources