Randomized Controlled Trial
. 2012 Dec 12;16(2):R56.
doi: 10.1186/cc11299.

Moderate glucose control results in less negative nitrogen balances in medical intensive care unit patients: a randomized, controlled study

Affiliations
Randomized Controlled Trial

Moderate glucose control results in less negative nitrogen balances in medical intensive care unit patients: a randomized, controlled study

Chien-Wei Hsu et al. Crit Care. .

Abstract

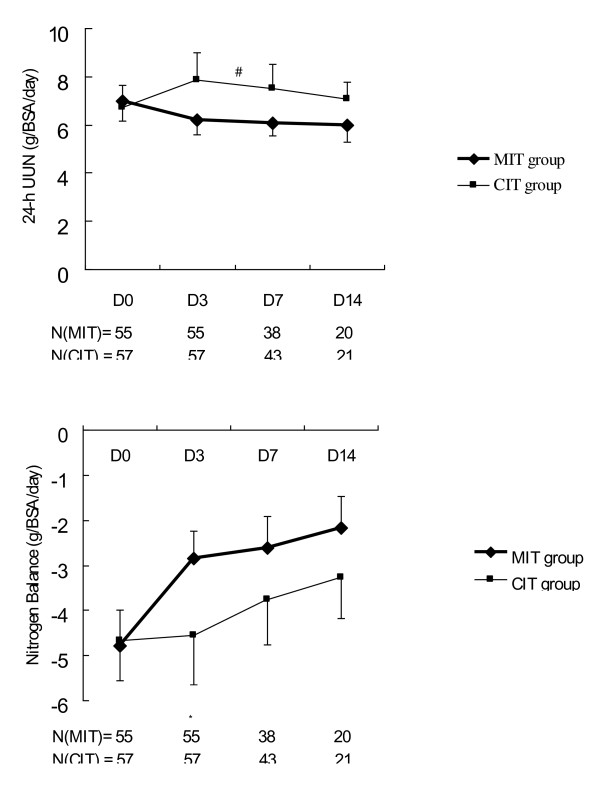
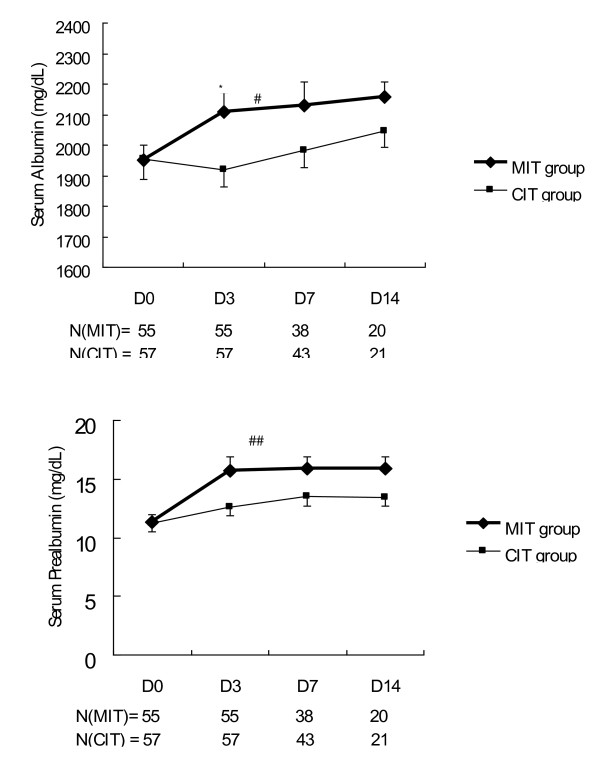
Introduction: Hyperglycemia and protein loss are common in critically ill patients. Insulin can be used to lower blood glucose and inhibit proteolysis. The impact of moderate insulin therapy on protein metabolism in critically ill patients has not been evaluated. We compared urinary nitrogen excretion, nitrogen balance, serum albumin concentrations, prealbumin concentrations, and clinical outcomes between patients receiving moderate insulin therapy (MIT) and conventional insulin therapy (CIT) in a medical ICU.

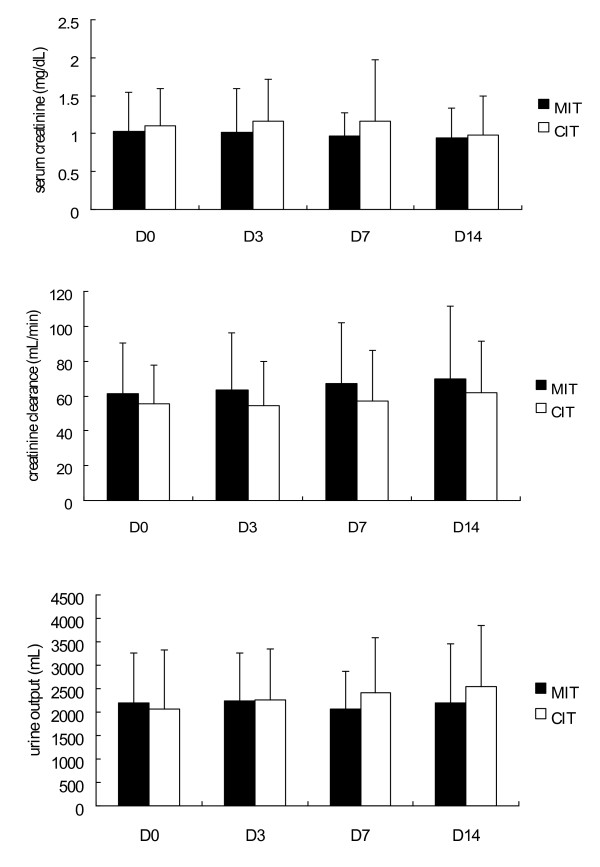
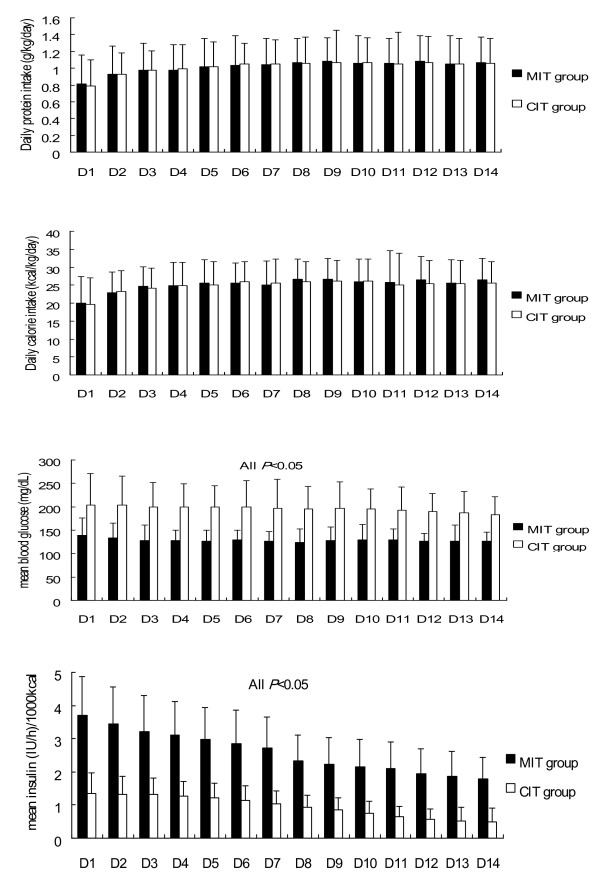
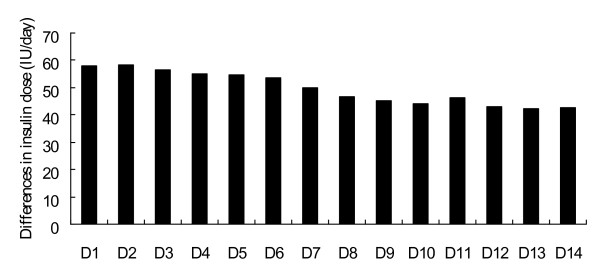
Methods: Patients were randomly divided into groups and treated with MIT (glucose target 120 to 140 mg/dl) or CIT (glucose target 180 to 200 mg/dl). Calories and protein intake were recorded each day. On days 3, 7 and 14, the 24-hour urinary nitrogen excretion, nitrogen balance, and serum albumin and prealbumin concentrations were measured. Clinical outcomes data were collected.

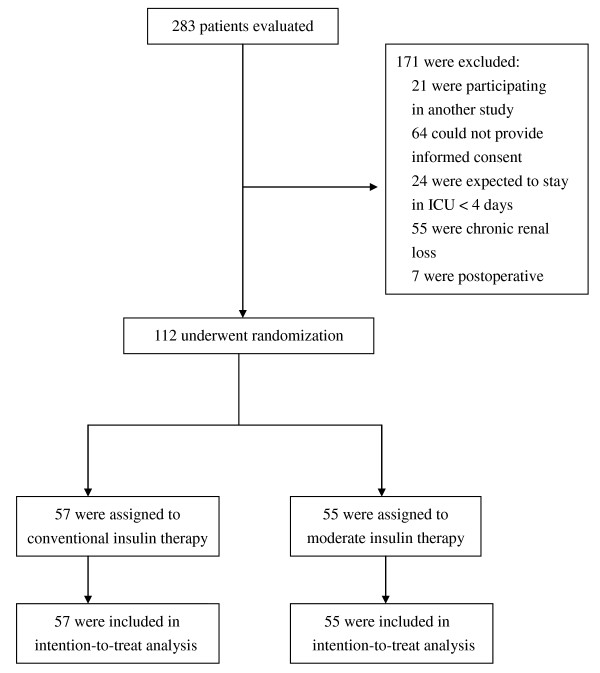
Results: A total of 112 medical ICU patients were included, with 55 patients randomized to the MIT group and 57 patients randomized to the CIT group. Patients treated with MIT showed a trend towards increased nitrogen balance (P = 0.070), significantly lower urinary nitrogen excretion (P = 0.027), and higher serum albumin (P = 0.047) and prealbumin (P = 0.001) concentrations than patients treated with CIT. The differences between the two groups were most significant on day 3, when all factors showed significant differences (P < 0.05).

Conclusions: Moderate glucose control results in less negative nitrogen balances in medical ICU patients. Differences are more significant in the early stages compared with the late stages of critical illness.

Trial registration: ClinicalTrial.Gov NCT 01227148.

Trial registration: ClinicalTrials.gov NCT01227148.


Figures

Figure 1
Figure 1
Assessment, randomization, and follow-up of the study patients. For detailed characteristics of randomized patients, see Table 1.
Figure 2
Figure 2
Serum creatinine, creatinine clearance and 24-hour urine output on days 0, 3, 7, and 14. Top, serum creatinine; middle, creatinine clearance; bottom, 24-hour urine output. Filled bars, patients receiving moderate insulin therapy (MIT group); open bars, patients receiving conventional insulin therapy (CIT group).
Figure 3
Figure 3
Daily protein, calories intake, mean blood glucose levels and insulin dose. Daily protein intake (top), daily caloric intake (second from top), mean blood glucose levels (second from bottom), and insulin dose (bottom) during the 2-week study period in the medical ICU. Filled bars, moderate insulin therapy (MIT) group; open bars, conventional insulin therapy (CIT) group.
Figure 4
Figure 4
Differences in mean daily insulin doses between moderate and conventional insulin therapy. Differences in mean daily insulin doses between the moderate insulin therapy group and the conventional insulin therapy group.
Figure 5
Figure 5
Twenty-four-hour urinary urea nitrogen and nitrogen balance in patients receiving moderate or conventional insulin therapy. Top, 24-hour urinary urea nitrogen (UUN); bottom, nitrogen balance. Data represent the mean ± standard deviation. A generalized linear model of repeated measurements showed statistically significant differences between the two groups: #P = 0.027 for entire study period, *P < 0.05 for day 3. BSA, body surface area; CIT, conventional insulin therapy; MIT, moderate insulin therapy.
Figure 6
Figure 6
Serum albumin and prealbumin levels in patients receiving moderate or conventional insulin therapy. Top, serum albumin; bottom, serum prealbumin. Data represent the mean ± standard deviation. A generalized linear model of repeated measurements showed statistically significant differences: #P = 0.047 for entire study period, ##P = 0.001 for entire study period, *P < 0.05 for day 3. CIT, conventional insulin therapy; MIT, moderate insulin therapy.

Comment in

References

    1. Levetan CS, Passaro M, Jablonski K, Kass M, Ratner RE. Unrecognized diabetes among hospitalized patients. Diabetes Care. 1998;16:246–249. doi: 10.2337/diacare.21.2.246. - DOI - PubMed
    1. Umpierrez GE, Isaacs SD, Bazargan N, You X, Thaler LM, Kitabchi AE. Hyperglycemia: an independent marker of in-hospital mortality in patients with undiagnosed diabetes. J Clin Endocrinol Metab. 2002;16:978–982. doi: 10.1210/jc.87.3.978. - DOI - PubMed
    1. Mizock BA. Alterations in fuel metabolism in critical illness: hyperglycaemia. Best Pract Res Clin Endocrinol Metab. 2001;16:533–551. doi: 10.1053/beem.2001.0168. - DOI - PubMed
    1. Robinson LE, van Soeren MH. Insulin resistance and hyperglycemia in critical illness: role of insulin in glycemic control. AACN Clin Issues. 2004;16:45–62. doi: 10.1097/00044067-200401000-00004. - DOI - PubMed
    1. Van den Berghe G, Wouters P, Weekers F, Verwaest C, Bruyninckx F, Schetz M, Vlasselaers D, Ferdinande P, Lauwers P, Bouillon R. Intensive insulin therapy in the critically ill patients. N Engl J Med. 2001;16:1359–1367. doi: 10.1056/NEJMoa011300. - DOI - PubMed

Publication types

Associated data