Review
. 2012 Sep;98(3):302-15.
doi: 10.1016/j.pneurobio.2012.03.001. Epub 2012 Apr 3.

High-frequency oscillations (HFOs) in clinical epilepsy

Affiliations
Review

High-frequency oscillations (HFOs) in clinical epilepsy

J Jacobs et al. Prog Neurobiol. 2012 Sep.

Abstract

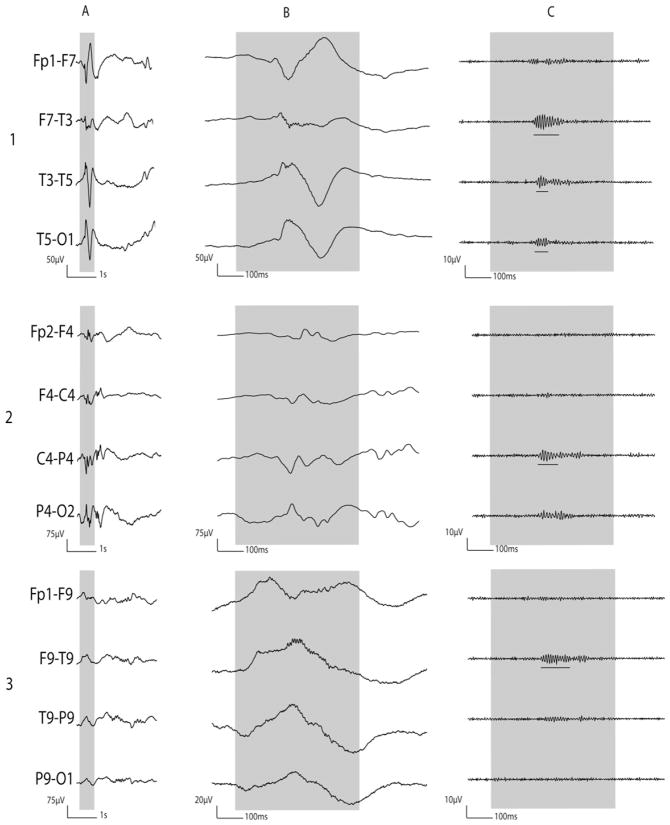
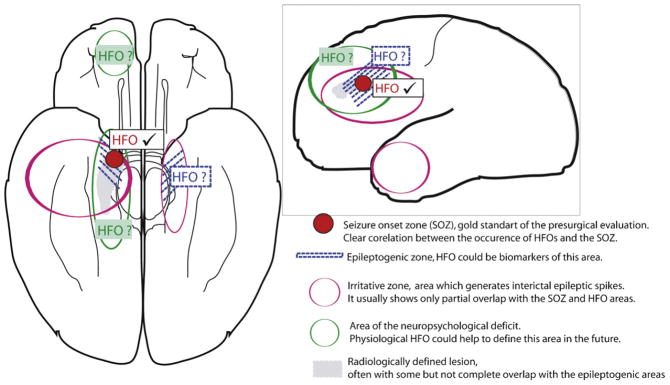
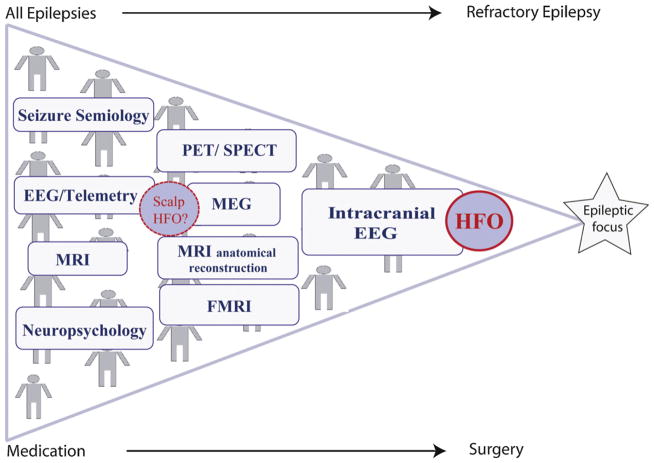
Epilepsy is one of the most frequent neurological diseases. In focal medically refractory epilepsies, successful surgical treatment largely depends on the identification of epileptogenic zone. High-frequency oscillations (HFOs) between 80 and 500Hz, which can be recorded with EEG, may be novel markers of the epileptogenic zone. This review discusses the clinical importance of HFOs as markers of epileptogenicity and their application in different types of epilepsies. HFOs are clearly linked to the seizure onset zone, and the surgical removal of regions generating them correlates with a seizure free post-surgical outcome. Moreover, HFOs reflect the seizure-generating capability of the underlying tissue, since they are more frequent after the reduction of antiepileptic drugs. They can be successfully used in pediatric epilepsies such as epileptic spasms and help to understand the generation of this specific type of seizures. While mostly recorded on intracranial EEGs, new studies suggest that identification of HFOs on scalp EEG or magnetoencephalography (MEG) is possible as well. Thus not only patients with refractory epilepsies and invasive recordings but all patients might profit from the analysis of HFOs. Despite these promising results, the analysis of HFOs is not a routine clinical procedure; most results are derived from relatively small cohorts of patients and many aspects are not yet fully understood. Thus the review concludes that even if HFOs are promising biomarkers of epileptic tissue, there are still uncertainties about mechanisms of generation, methods of analysis, and clinical applicability. Large multicenter prospective studies are needed prior to widespread clinical application.


Figures

Fig. 1
Fig. 1
Ictal discharges associated with epileptic spasms. (A) Ictal ECoG traces are shown with a low-frequency filter of 53 Hz and a high-frequency filter of 300 Hz. Ictal augmentation of HFOs occurred at channel 1 and quickly involved the surrounding channels. The end of HFOs augmentation occurred at channel 1 and sequentially involved the surrounding channels; this observation was referred to as the “ictal doughnut phenomenon”. The trigger point for time-frequency analysis was placed at the EMG onset detected at right deltoid muscles. (B) Time-frequency plots derived from 62 spasms are shown. Augmentation of HFOs preceded the EMG onset (denoted as ±0 ms). (C) The amplitudes of HFOs associated with spasms are shown. Source: Figure adapted from Nariai et al. (2011) with permission from John Wiley & Sons.
Fig. 2
Fig. 2
HFO recorded with macroelectrodes. This figure demonstrates ripples and fast ripples in the mesial temporal (A) and neocortical structures (B). HFOs are visualized on a different time scale and with different filter settings than the usual clinical EEG. In the two EEG segments on the left the amplitude scale is 50 times increase compared to those on the left to demonstrate the very small scale HFOs. HFOs in the mesial temporal structures are larger, of higher amplitude and more frequent than those in neocortical areas. Both EEGs derived from patients with non-lesional epilepsies. Source: Figure adapted from Jacobs et al. (2009c) with permission from John Wiley & Sons.
Fig. 3
Fig. 3
Co-occurrence between spikes and HFOs. HFO classification. (A) HFO together with spikes and visible as riding on the spike in the unfiltered EEG (B) HFO together with spikes but invisible in the unfiltered spike (C) Completely independent HFO, with no co-occurring spikes. Top: non-filtered EEG; middle: EEG filtered with high pass filter of 80 Hz; bottom: EEG filtered with high-pass filter of 250 Hz. Source: Figure adapted from Urrestarazu et al. (2007) with permission from Oxford Journals.
Fig. 4
Fig. 4
Representative time-frequency spectra and the corresponding electroencephalography (EEG) traces. Parts of the temporally expanded and filtered EEG traces are shown in the left column (low-cut filtered at 0.5 Hz in blue and filtered at 70 Hz in red). A ripple with a frequency above 100 Hz occurs in temporal association with the positive peak, the ascending slope, and/or the negative peak of the spike; it is barely visible near the spike-peak in the trace with a 0.5-Hz filter (magnification in box). The resulting time-frequency spectra in the right column show spectral spots (yellow arrows) in association with the spikes in the overlaid traces from the EEGs with CSWS (B corresponding to A with a peak frequency of 128.9 Hz; (D) corresponding to (C) with a peak frequency of 125.0 Hz). Source: Figure adapted from Kobayashi et al. (2010) with permission from John Wiley & Sons.
Fig. 5
Fig. 5
Ripples recorded with surface EEG. Example of ripples recorded on surface EEG. The upper section shows ripple oscillations co-occurring with a spike, with oscillations visible during the spike. The middle section shows a ripple co-occurring with a spike with oscillations not visible during the spike, but visible after filtering. In the bottom section a ripple independent of any spike can be observed. (A) Raw EEG. (B) Raw EEG with expanded time. (C) EEG filtered with high-pass filter of 80 Hz. Source: Figure adapted from Andrade-Valenca et al. (2011b) with permission of the Lippincott Williams & Wilkins.
Fig. 6
Fig. 6
Adaptation of the presurgical model of Rosenow and Lüders (Rosenow and Lüders, 2001). Up to now HFOs are able to identify the SOZ (in red). Studies about the correlation between HFO removal and post-surgical seizure outcome suggest that HFOs may also be able to measure the epileptogenic area (in blue). Whether this is true can only be measured by large prospective studies. Physiological HFOs at some point in the future might be able to help us define the area of the neuropsychological deficit (in green).
Fig. 7
Fig. 7
Pyramid of the presurgical diagnostic as it is performed in most epilepsy centers. Only patients with complicated and refractory seizures profit from the benefit of HFOs as biomarkers in intracranial EEG. Future identification of HFOs on surface EEG and MEG might allow a use of HFOs as long-term marker for epileptogenicity in a larger group of patients with epilepsy.

References

    1. Agirre-Arrizubieta Z, Huiskamp GJ, Ferrier CH, van Huffelen AC, Leijten FS. Interictal magnetoencephalography and the irritative zone in the electrocorticogram. Brain. 2009;132:3060–3071. - PubMed
    1. Allen PJ, Fish DR, Smith SJ. Very high-frequency rhythmic activity during SEEG suppression in frontal lobe epilepsy. Electroencephalography and Clinical Neurophysiology. 1992;82:155–159. - PubMed
    1. Andrade-Valenca L, Mari F, Jacobs J, Zijlmans M, Olivier A, Gotman J. Interictal high frequency oscillations (HFOs) in patients with focal epilepsy and normal MRI. Clinical Neurophysiology. 2011a Jul;123 [Epub ahead of print] - PMC - PubMed
    1. Andrade-Valenca LP, Dubeau F, Mari F, Zelmann R, Gotman J. Interictal scalp fast oscillations as a marker of the seizure onset zone. Neurology. 2011b;9:524–531. - PMC - PubMed
    1. Aubert S, Wendling F, Regis J, McGonigal A, Figarella-Branger D, Peragut JC. Local and remote epileptogenicity in focal cortical dysplasias and neurodevelopmental tumours. Brain. 2009;132:3072–3086. - PubMed

Publication types