. 2012 Aug 21;14(31):10835-43.
doi: 10.1039/c2cp40174f. Epub 2012 Apr 5.

Sparse sampling methods in multidimensional NMR

Affiliations

Sparse sampling methods in multidimensional NMR

Mehdi Mobli et al. Phys Chem Chem Phys. .

Abstract

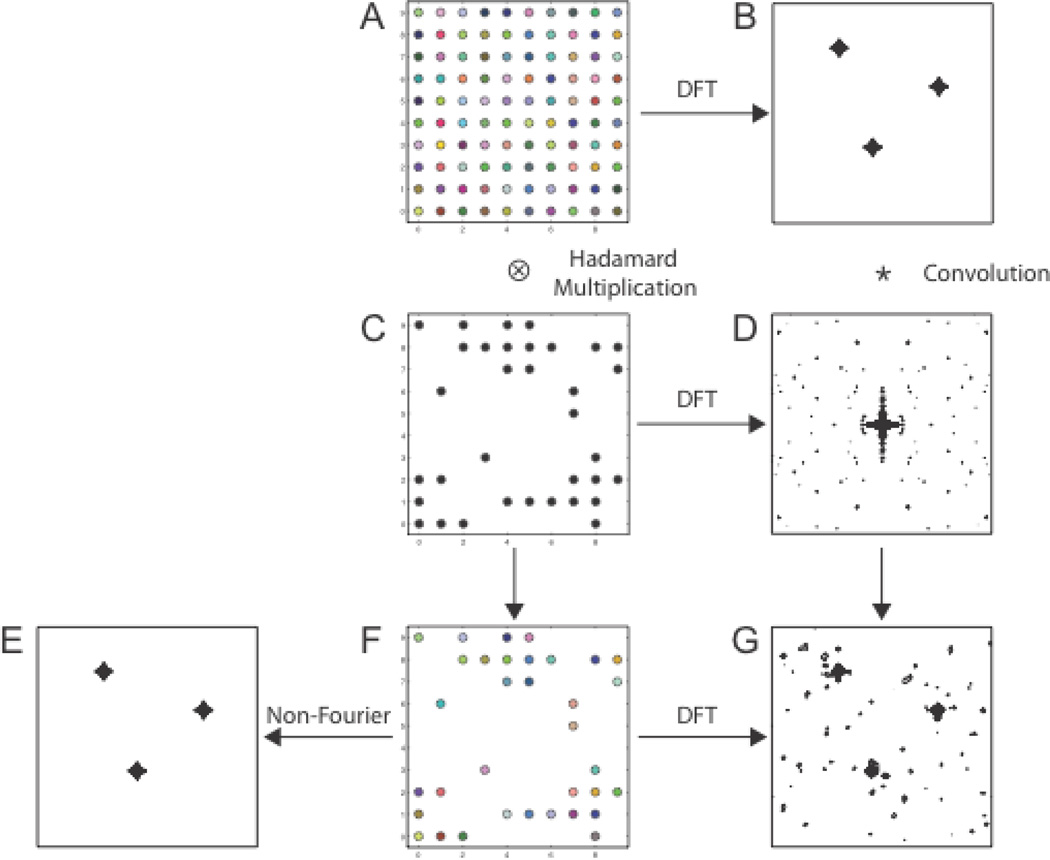
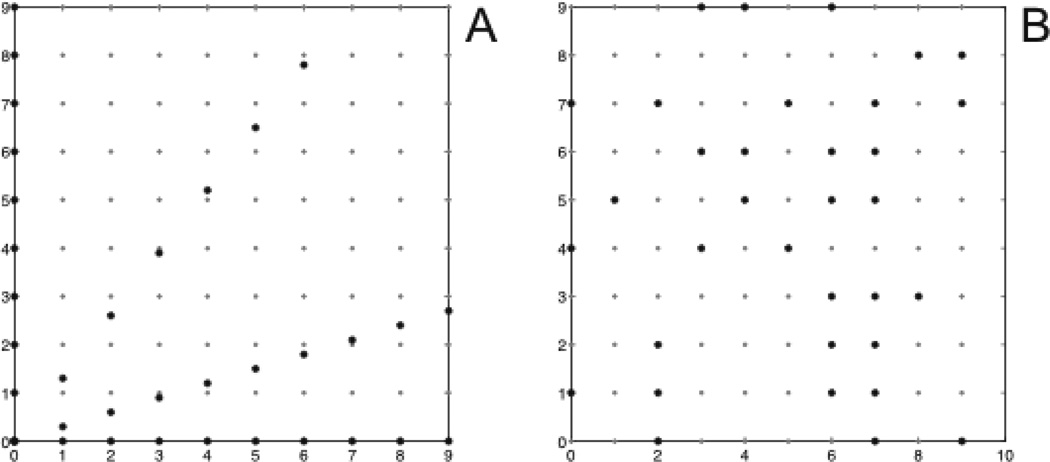
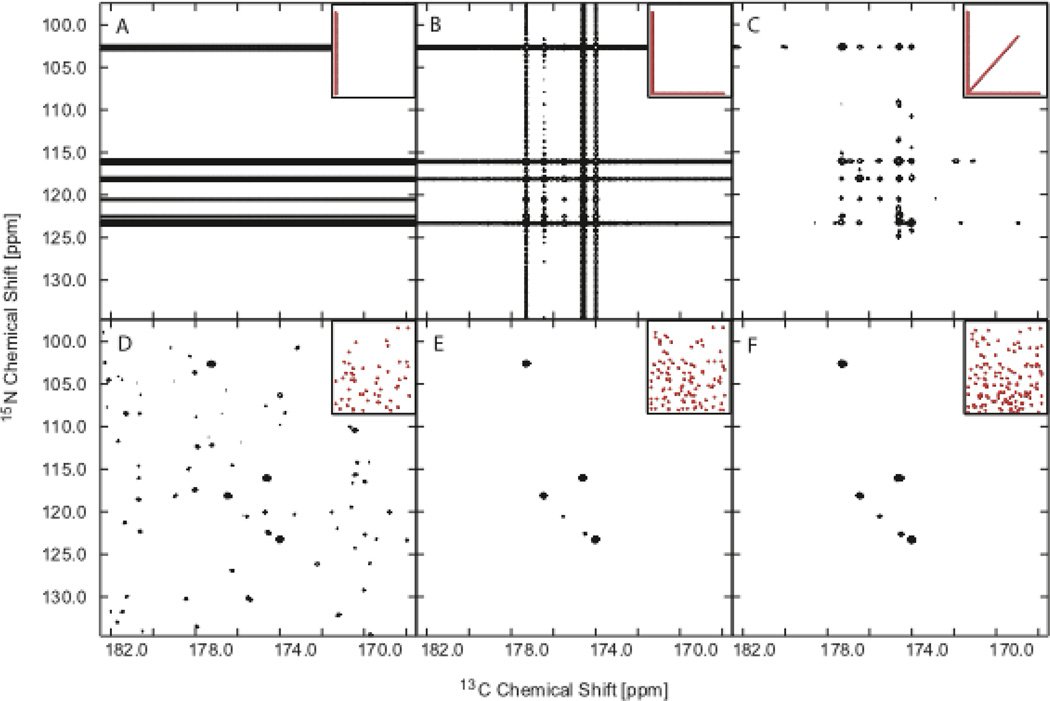
Although the discrete Fourier transform played an enabling role in the development of modern NMR spectroscopy, it suffers from a well-known difficulty providing high-resolution spectra from short data records. In multidimensional NMR experiments, so-called indirect time dimensions are sampled parametrically, with each instance of evolution times along the indirect dimensions sampled via separate one-dimensional experiments. The time required to conduct multidimensional experiments is directly proportional to the number of indirect evolution times sampled. Despite remarkable advances in resolution with increasing magnetic field strength, multiple dimensions remain essential for resolving individual resonances in NMR spectra of biological macromolecues. Conventional Fourier-based methods of spectrum analysis limit the resolution that can be practically achieved in the indirect dimensions. Nonuniform or sparse data collection strategies, together with suitable non-Fourier methods of spectrum analysis, enable high-resolution multidimensional spectra to be obtained. Although some of these approaches were first employed in NMR more than two decades ago, it is only relatively recently that they have been widely adopted. Here we describe the current practice of sparse sampling methods and prospects for further development of the approach to improve resolution and sensitivity and shorten experiment time in multidimensional NMR. While sparse sampling is particularly promising for multidimensional NMR, the basic principles could apply to other forms of multidimensional spectroscopy.


Figures

Figure 1
Figure 1
The role of the sampling function and PSF in NUS. The uniformly sampled data matrix is shown in A, with color used to indicate different data values. The sampling function (C) has the value 1 for sampled evolution times and 0 for those not sampled. The zero-augmented NUS data set (F) is the Hadamard product of the uniformly sampled data and the sampling function. In the matrices (C) and (F), entries with the value zero appear blank. The two-dimensional DFT of A is the uniformly sampled spectrum (B). The two-dimensional DFT of the sampling function (C) is the PSF (D). The two-dimensional DFT (G) of the zero-augmented NUS data (F) is equivalent to the convolution of the uniformly sampled spectrum with the PSF. Non-Fourier methods of spectrum analysis deconvolve the PSF to approximate (E) the spectrum that would have been obtained using uniform sampling, but from NUS data.
Figure 2
Figure 2
Examples of off-grid (A) and on-grid (B) sampling schemes. Panel A depicts radial sampling, employed by accordion, RD, GFT, BPR, HIFI, and APSY experiments. Random sampling schemes are typically restricted to a subset of the uniform grid defined by the Nyquist sampling interval in each dimension.
Figure 3
Figure 3
Examples of NUS sampling functions and PSFs in two nonuniformly sampled dimensions. Metrics reflecting the relative performance of these sampling schemes are given in Table 1. Purely random sampling (third row) yields the smallest sampling artifacts for a given level of coverage.
Figure 4
Figure 4
Influence of coverage and sampling scheme on NUS HNCO spectra of ubiquitin. All six panels depict the f3 (1H) plane of the spectrum corresponding to 8.14 ppm. For each panel the sampling scheme in t1-t2 is depicted in the red inset at the upper right. Top panels (A, B, C) show the addition of 0°, 90° and 30° projections of the two jointly sampled indirect dimensions, reconstructed using BPR. Each projection contains 52 complex points, thus the total number of complex points sampled in panels A, B, and C is 52, 104, and 156, respectively. The lower panels show MaxEnt reconstructions using the same sampling coverage, but distributed differently: randomly along the 15N dimension (constant time) and with an exponentially decreasing sampling density corresponding to a 15 Hz decay rate in the 13C dimension. The MaxEnt reconstruction parameters were selected using an automated protocol, .

References

    1. Ernst RR, Anderson WA. Rev. Sci. Instrum. 1966;37:93–102.
    1. Jeener J. Oral Presentation. Basko Polje Yugoslavia: Ampere International Summer School; 1971.
    1. Ni F, Scheraga HA. J. Magn. Reson. 1986;70:506–511.
    1. Stern AS, Li K-B, Hoch JC. J. Am. Chem. Soc. 2002;124:1982–1993. - PubMed
    1. Mobli M, Hoch JC, King GF. In: Advances in Biomedical spectroscopy. Dingley AJ, Pascal SM, editors. Amsterdam: IOS Press; 2011.

Publication types