. 2012 Apr;39(4):1991-2000.
doi: 10.1118/1.3693050.

Quantitative cone-beam CT imaging in radiation therapy using planning CT as a prior: first patient studies

Affiliations

Quantitative cone-beam CT imaging in radiation therapy using planning CT as a prior: first patient studies

Tianye Niu et al. Med Phys. 2012 Apr.

Abstract

Purpose: Quantitative cone-beam CT (CBCT) imaging is on increasing demand for high-performance image guided radiation therapy (IGRT). However, the current CBCT has poor image qualities mainly due to scatter contamination. Its current clinical application is therefore limited to patient setup based on only bony structures. To improve CBCT imaging for quantitative use, we recently proposed a correction method using planning CT (pCT) as the prior knowledge. Promising phantom results have been obtained on a tabletop CBCT system, using a correction scheme with rigid registration and without iterations. More challenges arise in clinical implementations of our method, especially because patients have large organ deformation in different scans. In this paper, we propose an improved framework to extend our method from bench to bedside by including several new components.

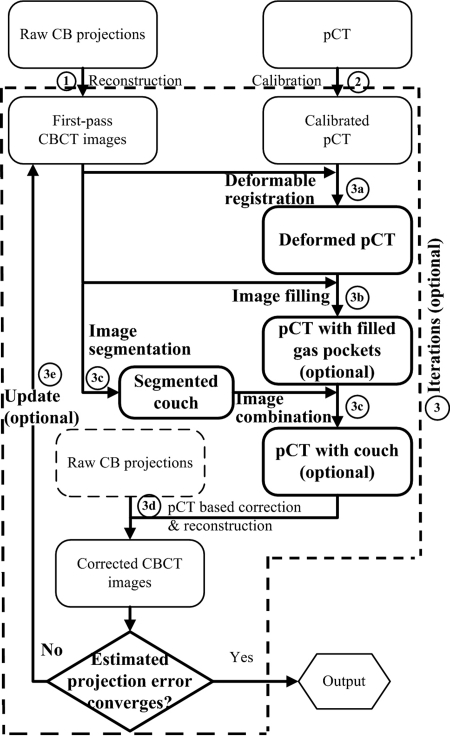
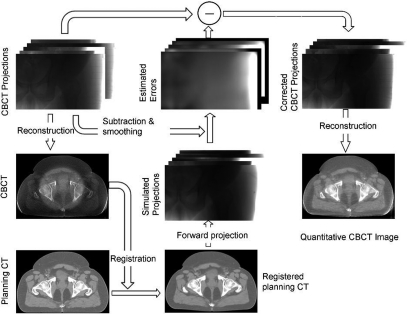
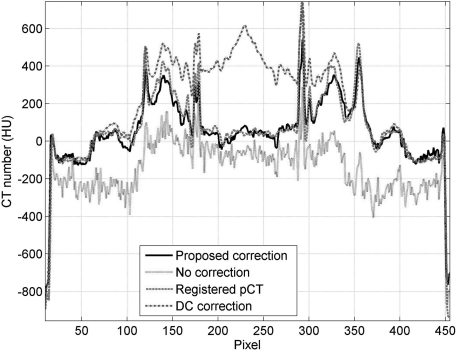
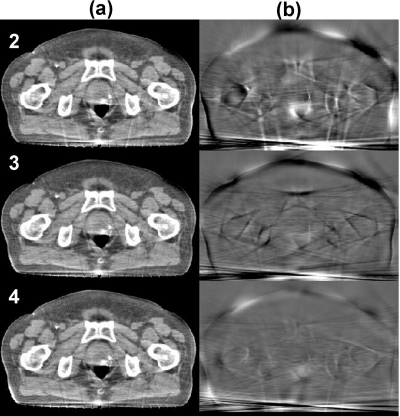
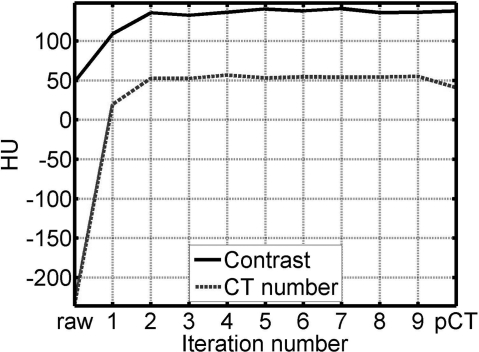
Methods: The basic principle of our correction algorithm is to estimate the primary signals of CBCT projections via forward projection on the pCT image, and then to obtain the low-frequency errors in CBCT raw projections by subtracting the estimated primary signals and low-pass filtering. We improve the algorithm by using deformable registration to minimize the geometry difference between the pCT and the CBCT images. Since the registration performance relies on the accuracy of the CBCT image, we design an optional iterative scheme to update the CBCT image used in the registration. Large correction errors result from the mismatched objects in the pCT and the CBCT scans. Another optional step of gas pocket and couch matching is added into the framework to reduce these effects.

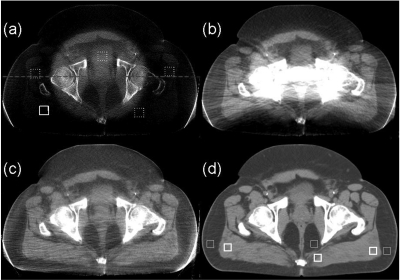
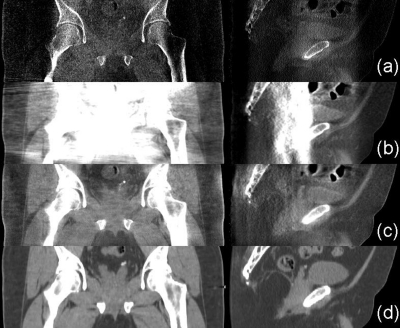
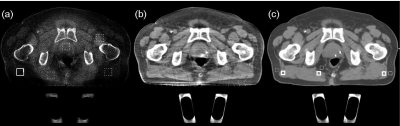
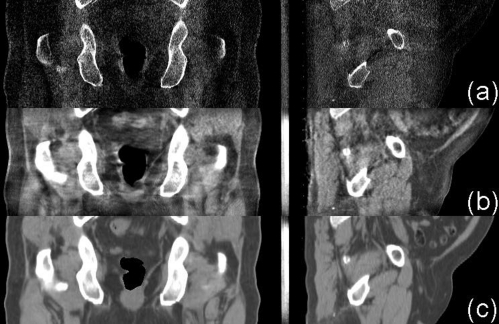
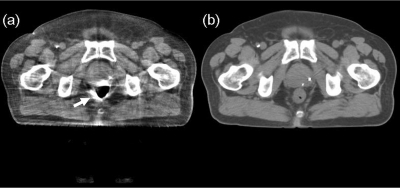
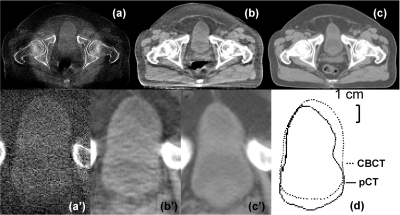
Results: The proposed method is evaluated on four prostate patients, of which two cases are presented in detail to investigate the method performance for a large variety of patient geometry in clinical practice. The first patient has small anatomical changes from the planning to the treatment room. Our algorithm works well even without the optional iterations and the gas pocket and couch matching. The image correction on the second patient is more challenging due to the effects of gas pockets and attenuating couch. The improved framework with all new components is used to fully evaluate the correction performance. The enhanced image quality has been evaluated using mean CT number and spatial nonuniformity (SNU) error as well as contrast improvement factor. If the pCT image is considered as the ground truth, on the four patients, the overall mean CT number error is reduced from over 300 HU to below 16 HU in the selected regions of interest (ROIs), and the SNU error is suppressed from over 18% to below 2%. The average soft-tissue contrast is improved by an average factor of 2.6.

Conclusions: We further improve our pCT-based CBCT correction algorithm for clinical use. Superior correction performance has been demonstrated on four patient studies. By providing quantitative CBCT images, our approach significantly increases the accuracy of advanced CBCT-based clinical applications for IGRT.


Figures

Figure 1
Figure 1
Improved workflow of the quantitative CBCT imaging scheme with the new components. The new components are highlighted in bold. The label of each step corresponds to the description in text.
Figure 2
Figure 2
One iteration of scatter correction [mainly step 3(d) in Fig. 1].
Figure 3
Figure 3
Raw cone-beam projection and the corresponding estimate of low-frequency errors using the proposed method. (a) cone-beam projection without correction and (b) estimated low-frequency errors (mainly scatter). The display windows are set to be (in detector units) (a) [0 2500] and (b) [0 300].
Figure 4
Figure 4
Axial images of the first prostate patient. Display window: [−300 200] HU. (a) CBCT without correction; (b) CBCT with uniform scatter correction; (c) CBCT with the proposed correction; and (d) registered pCT. In the selected uniform soft-tissue ROI [marked with a solid white square in (a)], the average CT numbers from (a) to (d) are −300, −10, 22, and 38 HU, respectively. The SNUs calculated on the selected five ROIs [marked with solid and dashed white squares in (a)] from (a) to (d) are 27%, 13%, 2.7%, and 1.1%, respectively. The dashed line in (a) indicates where the 1D profiles in Fig. 5 are taken. The thick and thin white square pairs in (d) indicate where the contrasts in Table TABLE I. are calculated.
Figure 5
Figure 5
Comparison of 1D profiles taken at the central horizontal line indicated in Fig. 4a.
Figure 6
Figure 6
Coronal (left) and sagittal views (right) of the reconstructed prostate patient. Display window: [−300 200] HU. Row (a) no correction; (b) with uniform correction; (c) with the proposed correction; and (d) registered pCT.
Figure 7
Figure 7
Axial images of the second prostate patient. Display window is [−300 200] HU. (a) CBCT without correction; (b) CBCT with the proposed correction after five iterations; and (c) registered pCT with matched gas pocket and couch. In the selected uniform soft-tissue ROI [marked with a solid white square in (a)], the average CT numbers from (a) to (c) are −236, 53, and 41 HU, respectively. The SNUs calculated on the selected five ROIs [marked with solid and dashed white squares in (a)] from (a) to (c) are 16%, 2.8%, and 1.9%, respectively. The thick and thin white square pairs in (c) indicate where the average contrasts in Table TABLE II. are calculated.
Figure 8
Figure 8
Coronal (left) and sagittal views (right) of the reconstructed prostate patient. Display window: [−300 200] HU. Row (a) no correction; (b) with the proposed correction after the fifth iteration; and (c) registered pCT with gas pocket and couch matching.
Figure 9
Figure 9
Effects of iterations in the proposed correction on the image quality. Display window: (a) [−300 200] HU and (b) [−80 120] HU. Column (a) corrected CBCT at different iterations (the iteration numbers are labeled at the upper-left corner) and (b) corresponding difference compared to the fifth iteration [Fig. 7b].
Figure 10
Figure 10
Demonstration of the convergence of the iterative scheme using the 2nd patient study as an example. The values of CT number and contrast are taken in the same ROIs indicated in Fig. 7. The numbers of the horizontal axis indicate the image of each iteration, in which the image of the first iteration is generated using the proposed correction with the pCT registered to a first-pass uncorrected CBCT image, i.e., the correction scheme shown in Fig. 2. The term “raw” means the CBCT image without correction.
Figure 11
Figure 11
Effects of the optional steps in the proposed correction (i.e. iterations, gas pocket, and couch matching) on the image quality. (a) CBCT image of the 1st iteration, without the optional steps. The arrow points to the severe streaking artifacts due to mismatched gas pocket and (b) registered pCT without gas pocket and couch matching. In the same ROIs indicated in Fig. 7a), the average CT number is 19 HU, and the SNU is 4.7%.
Figure 12
Figure 12
CBCT and registered pCT images of the bladder region. (a) CBCT without correction; (b) CBCT after the proposed correction; and (c) pCT after deformable registration. (a’)–(c’) enlarged views of bladder corresponding to (a)–(c). (d) comparison of the bladder contours of CBCT and registered pCT. The average CT numbers inside the bladder from (a) to (c) are −73, 3, and 14 HU, respectively. The contrasts are 69, 112, and 122 HU, respectively. Display window: [−300 200] HU.

References

    1. Altorjai G., Fotina I., Lutgendorf-Caucig C., Stock M., Potter R., Georg D., and Dieckmann K., “Cone-beam CT-based delineation of stereotactic lung targets: The influence of image modality and target size on interobserver variability,” Int. J. Radiat. Oncol., Biol., Phys. 82(2), e265–e272 (2012)10.1016/j.ijrobp.2011.03.042. - DOI - PubMed
    1. Lutgendorf-Caucig C., Fotina I., Stock M., Potter R., Goldner G., and Georg D., “Feasibility of CBCT-based target and normal structure delineation in prostate cancer radiotherapy: Multi-observer and image multi-modality study,” Radiother. Oncol. 98(2), 154–161 (2011).10.1016/j.radonc.2010.11.016 - DOI - PubMed
    1. Yang Y., Schreibmann E., Li T. F., Wang C., and Xing L., “Evaluation of on-board kV cone beam CT (CBCT)-based dose calculation,” Phys. Med. Biol. 52(3), 685–705 (2007).10.1088/0031-9155/52/3/011 - DOI - PubMed
    1. Yoo S. and Yin F. F., “Dosimetric feasibility of cone-beam CT-based treatment planning compared to CT-based treatment planning,” Int. J. Radiat. Oncol. 66(5), 1553–1561 (2006).10.1016/j.ijrobp.2006.08.031 - DOI - PubMed
    1. Lo T., Yang Y., Schreibniann E., Li T., and Xing L., “Mapping electron density distribution from planning CT to cone-beam CT (CBCT): A novel strategy for accurate dose calculation based on CBCT,” Int. J. Radiat. Oncol. 63(2), S507–S507 (2005).10.1016/j.ijrobp.2005.07.861 - DOI

Publication types

MeSH terms