. 2012 Apr 4;15(4):451-65.
doi: 10.1016/j.cmet.2012.02.013.

Impaired insulin/IGF1 signaling extends life span by promoting mitochondrial L-proline catabolism to induce a transient ROS signal

Affiliations

Impaired insulin/IGF1 signaling extends life span by promoting mitochondrial L-proline catabolism to induce a transient ROS signal

Kim Zarse et al. Cell Metab. .

Abstract

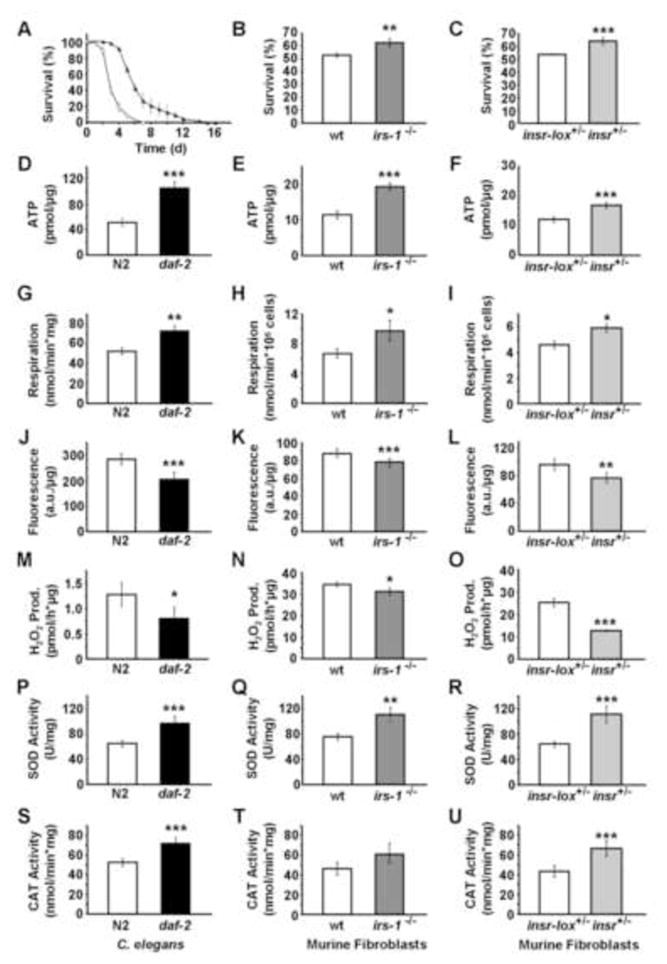
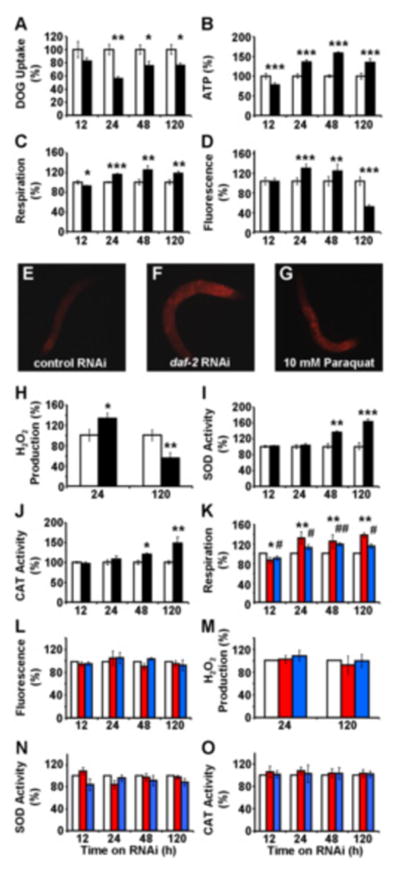
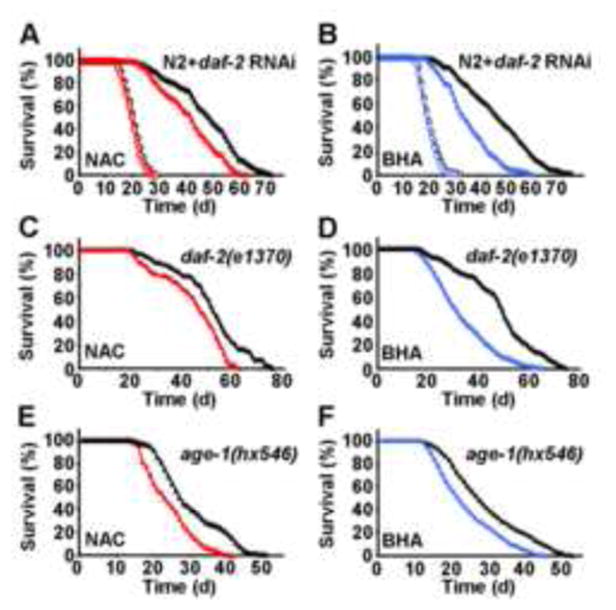
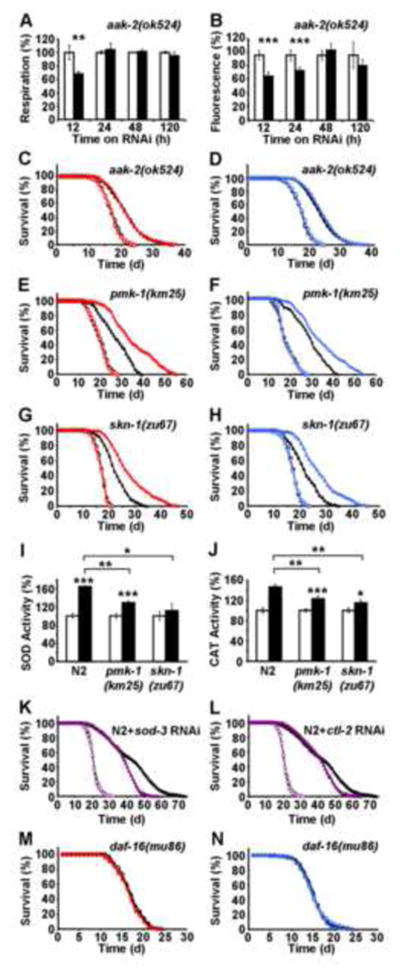
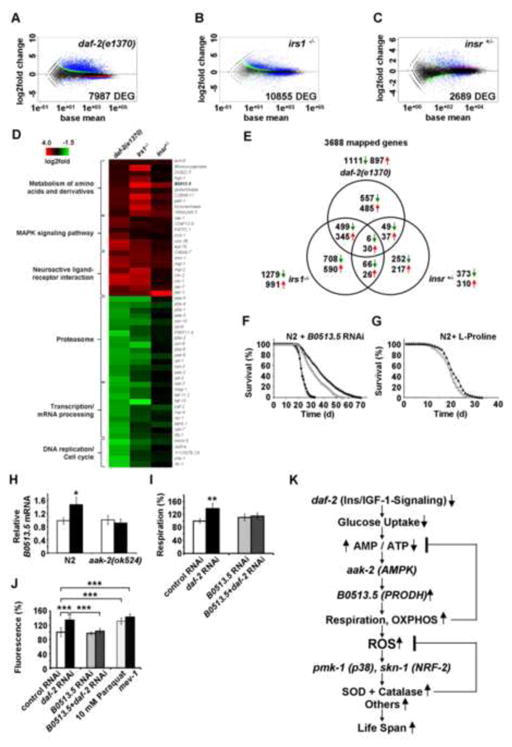
Impaired insulin and IGF-1 signaling (iIIS) in C. elegans daf-2 mutants extends life span more than 2-fold. Constitutively, iIIS increases mitochondrial activity and reduces reactive oxygen species (ROS) levels. By contrast, acute impairment of daf-2 in adult C. elegans reduces glucose uptake and transiently increases ROS. Consistent with the concept of mitohormesis, this ROS signal causes an adaptive response by inducing ROS defense enzymes (SOD, catalase), culminating in ultimately reduced ROS levels despite increased mitochondrial activity. Inhibition of this ROS signal by antioxidants reduces iIIS-mediated longevity by up to 60%. Induction of the ROS signal requires AAK-2 (AMPK), while PMK-1 (p38) and SKN-1 (NRF-2) are needed for the retrograde response. IIIS upregulates mitochondrial L-proline catabolism, and impairment of the latter impairs the life span-extending capacity of iIIS while L-proline supplementation extends C. elegans life span. Taken together, iIIS promotes L-proline metabolism to generate a ROS signal for the adaptive induction of endogenous stress defense to extend life span.


Figures

Figure 1
Figure 1. Constitutive impaired insulin-/IGF1-signaling induces mitochondrial metabolism, reduces ROS levels, and increases endogenous antioxidant defense in both C. elegans and murine embryonic fibroblasts
(A–C) Survival on paraquat (D–F) ATP content, (G–I) oxygen consumption, (J–L) mitochondrial ROS levels, (N–O) hydrogen peroxide production, (P–R) superoxide dismutase activity, (S–U) catalase activity, each quantified in (A, D, G, J, M, P, S) daf-2(e1370) nematodes or (B, E, H, K, N, Q, T) IRS1−/− MEFs or (C, F, I, L, O, R, U) IR+/− MEFs (all depicted in black bars) relative to effects in the respective wild-type controls (white bars). All values are given as mean ± SD. *p<0.05, **p<0.01, ***p<0.001 versus respective controls.
Figure 2
Figure 2. Acute impairment of daf-2 signaling transiently induces mitochondrial ROS levels to promote endogenous antioxidant defense
(A) 2-Deoxy-glucose uptake, (B) ATP content, (C) oxygen consumption and (D) mitochondrial ROS levels each following exposure to RNAi against daf-2 (black bars) relative to effects on control RNAi-treated nematodes (white bars) at different time points. (E–G) Fluorescent microphotographs (enlargement: 10fold) of MitoTracker Red CM-H2X-treated nematodes, (E) after 24 h of control RNAi treatment, (F) after 24 h of daf-2 RNAi treatment, (G) after 1 h of paraquat treatment (positive control). (H) Hydrogen peroxide production, (I) superoxide dismutase activity, (J) catalase activity, each following exposure to RNAi against daf-2 (black bars) relative to effects on control RNAi-treated nematodes (white bars) at different time points. (K) Oxygen consumption, (L) mitochondrial ROS levels, (M) hydrogen peroxide production, (N) superoxide dismutase activity, (O) catalase activity, each following exposure to RNAi against daf-2 in the presence of the antioxidants NAC (red bars) and BHA (blue bars) relative to effects on control RNAi-treated nematodes in the presence of antioxidants (white bars) at different time points. In all panels relative values are depicted; for absolute values, please see Figure S2. All values are given as mean ± SD. * and # p<0.05, **and ## p<0.01, ***p<0.001 versus respective controls.
Figure 3
Figure 3. Exogenous antioxidants impair the life span-extending effects of daf-2 impairment
(A) Lifespan analyses of nematodes exposed to control-RNAi (open circles) in the presence (red) or absence (black) of the antioxidant NAC; life span analyses of nematodes exposed to RNAi against daf-2 (closed triangles) in the presence (red) or absence (black) of NAC. (B) Lifespan analyses in the presence of RNAi as above replacing NAC with the antioxidant BHA (blue). (C) Lifespan analyses of daf-2(e1370) nematodes (closed triangles) in the presence (red) or absence (black) of NAC. (D) Lifespan analyses of daf-2(e1370) nematodes replacing NAC with BHA (blue). (E) Lifespan analyses of age-1(hx546) nematodes (closed triangles) in the presence (red) or absence (black) of NAC. (F) Lifespan analyses of age-1(hx546) nematodes replacing NAC with BHA (blue).
Figure 4
Figure 4. Molecular regulation of ROS-dependent extension of life span following daf-2 impairment
(A) Oxygen consumption, (B) mitochondrial ROS levels in aak2(ok524) nematodes following exposure to RNAi against daf-2 (black bars) relative to effects on control RNAi-treated aak2(ok524) nematodes (white bars) at different time points. In both panels relative values are depicted; for absolute values, see Figure S3. (C) Lifespan analyses of aak-2(ok524) nematodes exposed to control-RNAi (open circles) in the presence (red) or absence (black) of the antioxidant NAC; life span analyses of aak2(ok524) nematodes exposed to RNAi against daf-2 (closed triangles) in the presence (red) or absence (black) of NAC. (D) Lifespan analyses in the presence of mutation and RNAi as in C, replacing NAC with the antioxidant BHA (blue). (E) Lifespan analyses of pmk-1(km25) nematodes exposed to control-RNAi (open circles) in the presence (red) or absence (black) of NAC; life span analyses of pmk-1(km25) nematodes exposed to RNAi against daf-2 (closed triangles) in the presence (red) or absence (black) of NAC; (F) Lifespan analyses in the presence of mutation and RNAi as in E, replacing NAC with BHA (blue). (G) Lifespan analyses of skn-1(zu67) nematodes exposed to control-RNAi (open circles) in the presence (red) or absence (black) of NAC; life span analyses of skn-1(zu67) nematodes exposed to RNAi against daf-2 (closed triangles) in the presence (red) or absence (black) of NAC. (H) Lifespan analyses in the presence of mutation and RNAi as in G, replacing NAC with BHA (blue). Activities of superoxide dismutase (I) and catalase (J) in wild-type nematodes and mutants for pmk-1 and skn-1 without (white bars) and with (black bars) daf-2 RNAi treatment for 5 days. In panels I and J relative values are depicted; for absolute values, see Figure S3. (K) Lifespan analyses of N2 nematodes exposed to control RNAi (empty circles) and daf-2 RNAi (black triangles) in comparison to exposure against sod-3 RNAi (purple circles) alone and co-incubation with daf-2 RNAi (purple triangles). (L) Lifespan analyses of N2 nematodes exposed to control RNAi (empty circles) and daf-2 RNAi (black triangles) in comparison to exposure against ctl-2 RNAi (purple circles) alone and co-incubation with daf-2 RNAi (purple triangles). (M) Lifespan analyses of daf-16(mu86) nematodes exposed to control-RNAi (open circles) in the presence (red) or absence (black) of NAC; lifespan analyses of daf-16(mu86) nematodes exposed to RNAi against daf-2 (closed triangles) in the presence (red) or absence (black) of NAC. (N) Lifespan analyses in the presence of mutation and RNAi as in M, replacing NAC with BHA (blue). In panels A, B, I and J values are given as mean ± SD. *p<0.05, **p<0.01, ***p<0.001 versus respective controls.
Figure 5
Figure 5. Trans-species transcriptome analysis identifies increased L-proline catabolism as a life span extending response to reduced glucose metabolism in states of impaired insulin-/IGF1-signaling
Differentially expressed genes as quantified by deep sequencing analysis for (A) daf-2 nematodes, (B) IRS1−/− MEFs and (C) IR+/− MEFs, all in comparison to respective controls; black dots indicate no differential regulation, red and green dots indicate regulation according to one statistical method only. Blue dots indicate regulation according to both statistical methods (used for further analysis). (D) functional groups of down-regulated and up-regulated genes (cut-off for at least two out of three sets: p=0.05). For details, please see also Table S1. (E) Venn analyses of differentially expressed genes derived from daf-2 nematodes, IRS1−/− MEFs and IR+/− MEFs (cut-off for all three sets: p=0.05). For details, please see also Table 2. (F) Lifespan analyses of N2 nematodes exposed to control RNAi (empty circles) and daf-2 RNAi (filled triangles) in comparison to exposure against B0513.5 RNAi (closed circles) alone and co-incubation with daf-2 RNAi (empty triangles, respectively). (G) Lifespan analysis of N2 nematodes exposed to L-proline (filled triangles) or solvent (empty circles). (H) Expression of B0513.5/prodh mRNA in the absence (white bars) and presence (black bars bars) of daf-2 RNAi for 48 h in wild-type (N2) and aak-2 mutant nematodes. (I) Oxygen consumption in N2 nematodes treated with control RNAi (white bars) or daf-2 RNAi (black bars), and the additional presence of RNAi against B0513.5/prodh (grey/striped bars), all after 48 h of treatment. (J) ROS levels in nematodes treated with RNAis as in Panel (I) for 48 h; mev-1(kn1) mutants and paraquat treatment for 1 h serve as positive controls. In panels I and J relative values are depicted; for absolute values, see Figure S4. In panels H J values are given as mean ± SD. *p<0.05, **p<0.01, ***p<0.001 versus respective controls. (K) Impaired insulin-/IGF1-signaling promotes L-proline catabolism to employ ROS as a mitochondrial second messenger culminating in extended life span: Impaired IIS causes reduction of glucose uptake in C. elegans, which leads to an intermittent energy deficit that activates mitochondrial respiration by increasing L-proline catabolism in an aak-2 dependent manner. This induction of mitochondrial respiration generates a transient ROS signal, which is sensed by PMK-1 and SKN-1 to secondarily cause an adaptive response to increase the respective activities of superoxide dismutase and catalase which ultimately terminate the initial ROS signal, in parallel leading to increased stress resistance and extended C. elegans life span.

Comment in

References

    1. Al-Regaiey KA, Masternak MM, Bonkowski M, Sun L, Bartke A. Long-lived growth hormone receptor knockout mice: interaction of reduced insulin-like growth factor i/insulin signaling and caloric restriction. Endocrinology. 2005;146:851–860. - PubMed
    1. Anders S, Huber W. Differential expression analysis for sequence count data. Genome Biol. 2010;11:R106. - PMC - PubMed
    1. Apfeld J, O’Connor G, McDonagh T, DiStefano PS, Curtis R. The AMP-activated protein kinase aak-2 links energy levels and insulin-like signals to lifespan in C. elegans. Genes Dev. 2004;18:3004–3009. - PMC - PubMed
    1. Barros MH, Bandy B, Tahara EB, Kowaltowski AJ. Higher respiratory activity decreases mitochondrial reactive oxygen release and increases life span in Saccharomyces cerevisiae. J Biol Chem. 2004;279:49883–49888. - PubMed
    1. Bartke A, Wright JC, Mattison JA, Ingram DK, Miller RA, Roth GS. Extending the lifespan of long-lived mice. Nature. 2001;414:412. - PubMed

Publication types

MeSH terms