. 2012 Apr 4;15(4):480-91.
doi: 10.1016/j.cmet.2012.03.009.

In vivo identification of bipotential adipocyte progenitors recruited by β3-adrenoceptor activation and high-fat feeding

Affiliations

In vivo identification of bipotential adipocyte progenitors recruited by β3-adrenoceptor activation and high-fat feeding

Yun-Hee Lee et al. Cell Metab. .

Abstract

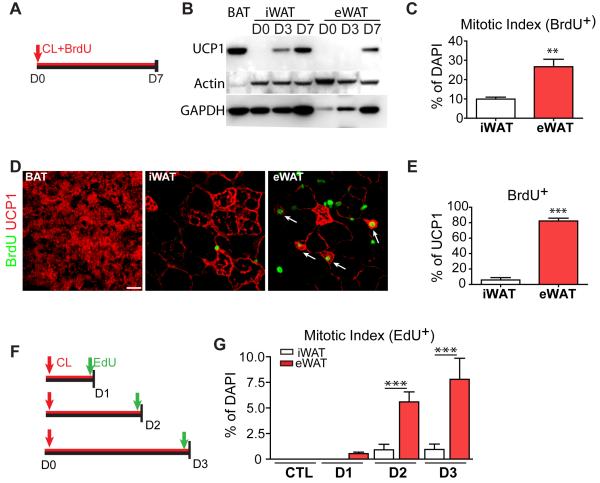
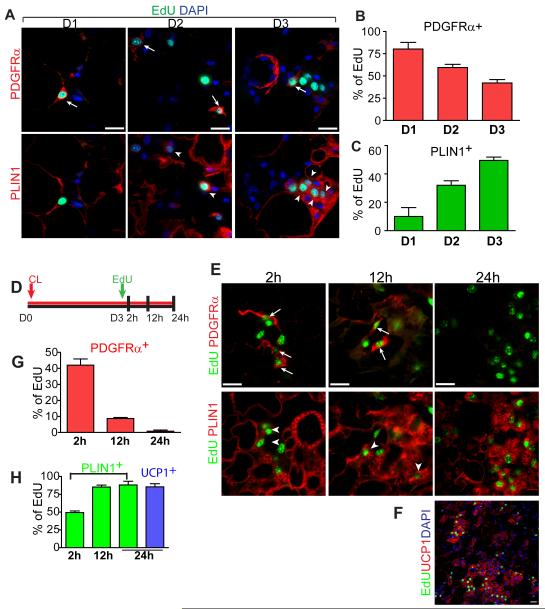
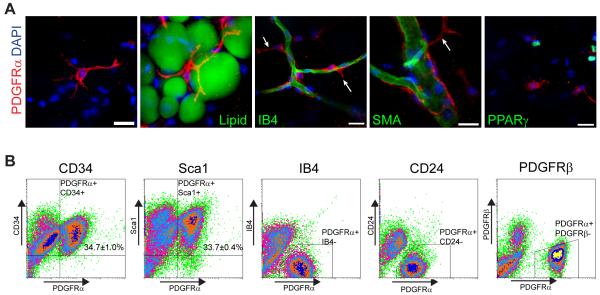
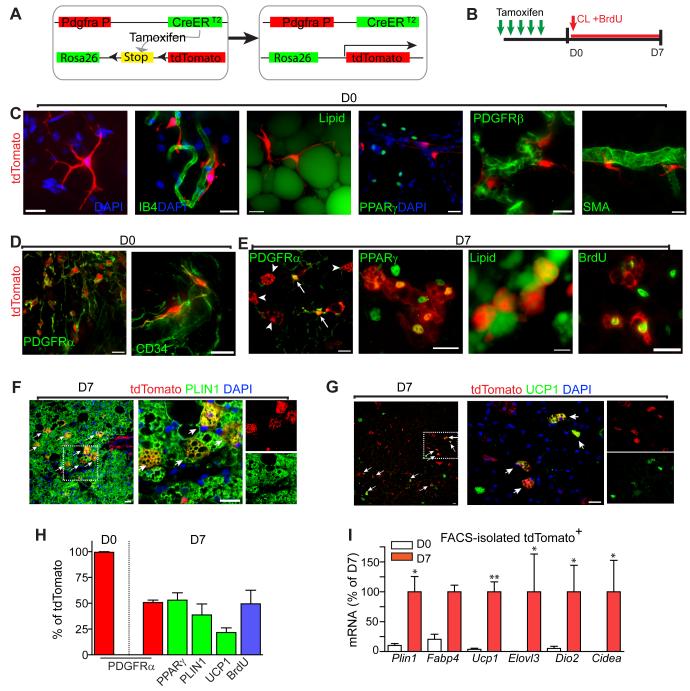
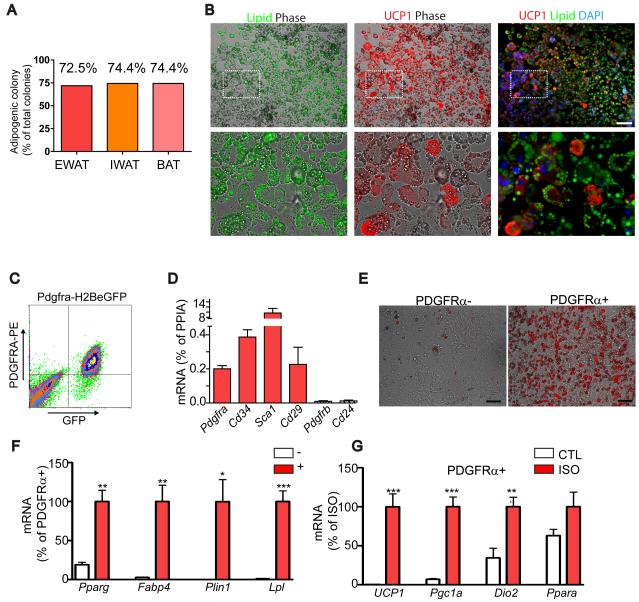
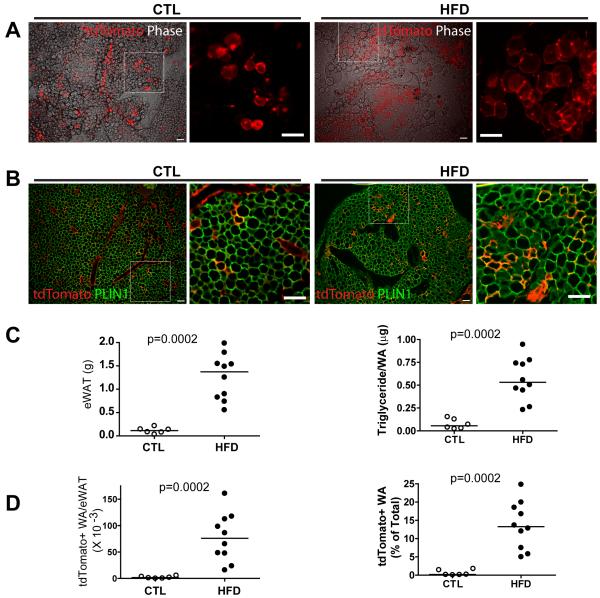
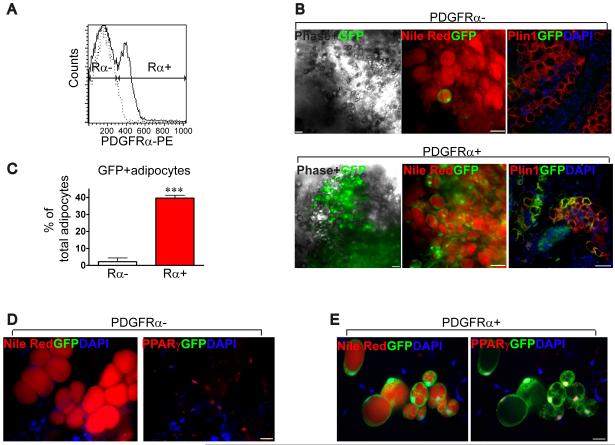
Nutritional and pharmacological stimuli can dramatically alter the cellular phenotypes in white adipose tissue (WAT). Utilizing genetic lineage tracing techniques, we demonstrate that brown adipocytes (BA) that are induced by β3-adrenergic receptor activation in abdominal WAT arise from the proliferation and differentiation of cells expressing platelet-derived growth factor receptor alpha (PDGFRα), CD34, and Sca-1 (PDGFRα(+) cells). PDGFRα(+) cells have a unique morphology in which extended processes contact multiple cells in the tissue microenvironment. Surprisingly, these cells also give rise to white adipocytes (WA) that can comprise up to 25% of total fat cells in abdominal fat pads following 8 weeks of high-fat feeding. Isolated PDGFRα(+) cells differentiated into both BA and WA in vitro and generated WA after transplantation in vivo. The identification of PDGFRα(+) cells as bipotential adipocyte progenitors will enable further investigation of mechanisms that promote therapeutic cellular remodeling in adult WAT.


Figures

Figure 1
Figure 1. iBA in WAT are derived from proliferating cells during β3- adrenergic stimulation
(A) Cumulative BrdU labeling during continuous CL316,243 (CL) treatment. (B) Immunoblot analysis of WAT from 129S1 mice treated with CL. Equal amounts of proteins were run, and blots sequentially probed for UCP1, and loading controls. (C-E) BrdU incorporation analysis in adipose tissue 7 days after CL treatment. (C) CL induced greater proliferation in eWAT versus iWAT (n = 4 per group, p=0.006). (D) Representative images of BrdU+, UCP1+ cells in tissue paraffin sections with arrows indicating double-positive multilocular adipocytes, (E) Proliferation of iBA in iWAT and eWAT. Values are the percentage of BrdU+,UCP1+ to total UCP1+ cells. (mean ± SEM, n = 4 per group, p<0.0001). (F) EdU flash-labeling. 129S1 mice were infused with CL up to 3 days and injected with EdU 2 h before analysis. (G) CL significantly increased mitotic indices of both eWAT and iWAT (p<0.0001), and the effect was significantly greater in eWAT versus iWAT (ANOVA interaction p=0.0033, post-test ***p<0.001) (mean ± SEM, n = 3-4 per group). See also Figure S1.
Figure 2
Figure 2. Fate tracing of proliferating cells identifies PDGFRα+ cells as potential iBA progenitors
(A) Representative images of eWAT paraffin sections triple-stained for PDGFRα, PLIN1 and EdU on D1, D2, or D3 of CL treatment. Note that images of a given day are the same microscopic field. Top row shows merge of PDGFRα (red) and EdU (green), while bottom row is merge of PLIN1 (red) and EdU (green). Arrows mark PDGFRα+ EdU+ cells. Arrow heads mark PLIN1+ EdU+ cells. Nuclei were counterstained with DAPI (Blue). Triply stained images demonstrate that PLIN1 and PDGFRα expression are mutually exclusive. (B, C) Quantification of PDGFRα+ EdU+ cells, or PLIN1+ EdU+ cells in eWAT paraffin sections (mean ± SEM, n = 3-4 per group). Nearly all proliferating cells in eWAT express either PDGFRα or PLIN1. The percentage of PLIN1+, EdU+ cells increased over time (B, p=0.0004) as the percentage of PDGFRα+, Edu+ cells declined (C, p=0.002). (D) Fate tracing of cells labeled with EdU on the third day of CL treatment. 129S1 mice were infused with CL, injected with EdU on D3, and analyzed at indicated time points. (E) Representative images of eWAT paraffin sections triple-stained for PDGFRα, PLIN1 and EdU at 2 h, 12 h, and 24 h after EdU injection. Top row shows merge of PDGFRα (red) and EdU (green), while bottom row is merge of PLIN1 (red) and EdU (green) of the same field. Arrows mark PDGFRα+ EdU+ cells. Arrow heads mark PLIN1+ EdU+ cells. (F) Low magnification fields of eWAT paraffin sections double-stained for EdU (green) and UCP1 (red) at 24h after EdU injection. (G, H) Proportion of each cell type is expressed as percentage of the total EdU+ cells (mean ± SEM, n = 3-4 per group). PDGFRα expression declined (p=0.0002) as PLIN1 expression appeared (p=0.0001) in EdU-labeled cells. By 24 h, 85% of EdU+ cells expressed UCP1. Bars = 20 μm. See also Figure S2.
Figure 3
Figure 3. Phenotypic and morphological characteristics of PDGFRα+ cells
(A) Immunostaining of PDGFRα+ cells in eWAT whole mount from control 129S1 mice. (A) Stellate morphology of PDGFRα+ cells (red). Each cell had multiple processes, some up to 50 μm long, and contacted multiple cells, including adipocytes (Lipid+). PDGFRα+ cells were often in close apposition to IB4+ vasculature (green), but did not constitute the mural compartment, indicated by extended processes (arrows). PDGFRα+ cells were negative for SMA and PPARγ. Nuclei were counterstained with DAPI. Bars = 20 μm. (B) FACS analysis on cell surface marker expression of PDGFRα+ cells. PDGFRα+ cells were uniformly positive for CD34 and Sca1, but negative for IB4, CD24, and PDGFRβ. The percentage of double positive cells are indicated on the flow profile (mean ± SEM, n = 3 independent analyses). See also Figure S3 and Movie S1.
Figure 4
Figure 4. PDGFRα expressing progenitors become BA during β3-adrenergic stimulation
(A) Schematic diagram of the inducible Pdgfra-CreERT2/R26-LSL-tdTomato reporter system. (B) Procedure of reporter induction and lineage tracing of tdTomato-labeled cells. Efficiency and specificity of reporter induction were analyzed 7 days after the first tamoxifen dose. Adipose tissue was analyzed before (D0) or 7 days (D7) after CL and BrdU infusion. (C,D) Characterization of reporter+ cells prior to CL treatment. Labeled cells were often found near blood vessels (IB4+) and had long processes that appeared to contact stromal cells and adipocytes (LipidTox+). tdTomato+ cells were negative for PPARγ, PDGFRβ, and SMA, but uniformly positive for PDGFRα and CD34. (E-G) Characterization of reporter+ cells following 7 days of CL treatment. tdTomato+ multilocular adipocytes (arrow heads) lacked expression of PDGFRα, whereas stellate-like progenitors (arrows) remained PDGFRα+. tdTomato+ multilocular cells coexpressed PPARγ, UCP1, and contained PLIN1+ lipid droplets. Incorporation of BrdU of tdTomato+ multilocular adipocytes indicates that iBA came from proliferating cells. (F, G) Low magnification images of eWAT paraffin sections double stained for tdTomato and PLIIN1 (F), or UCP1 (G). Arrows mark double positive cells. Right is a magnified view of the boxed region from left. Bars = 20 μm. (H) Distribution of markers in tdTomato+ cells (mean ± SEM, n = 3 per group). All tdTomato+ cells expressed PDGFRα and none expressed PPARγ on day 0. By day 7, 47.3 ± 1.5% of tdTomato+ cells retained expression of PDGFRα while 44.3 ± 14.6 % of tdTomato+ cells expressed PPARγ (Fisher’s exact test, p<0.0001). In addition, PLIN1 (38.7 ± 10.6%) and UCP1 (21.5 ± 4.4%) expression and BrdU incorporation (49.3 ± 13.2) were detected in tdTomato+ cells. (I) qPCR analysis of BA marker expression in Pdgfra-tdTomato tagged cells isolated by FACS, expressed relative mRNA levels of D7. BA markers were significantly upregulated in tdTomato+ cells after 7 days of CL treatment. (mean ± SEM, n = 4-5, Plin1: p=0.016, fatty acid bind protein 4 (Fabp4): p=0.057, UCP1: p=0.008, and Elovl3: p=0.029, Dio2: p=0.033, Cidea: p=0.011). See also Figure S4 and Movie S2.
Figure 5
Figure 5. PDGFRα-expressing progenitors are white and brown adipogenic in vitro
(A-B) Adipogenic potential of clones (n > 39) derived from FACS-isolated PDGFRα+ single cells. (B) Representative images of adipogenic clones double-stained for UCP1 and Lipid (LipidTox). Lipid (left) and UCP1 (middle) fluorescent images were merged with phase contrast, and Lipid and UCP1 images were merged wth DAPI-counterstained images. Bottom row is a magnified view of the boxed regions from top row. All adipogenic clones contained UCP1+ and UCP1- adipocytes, demonstrating WA and BA bipotentiality of PDGFRα+ progenitors. Bar = 100 μm. (C) FACS analysis of H2BeGFP+ (PDGFRα+) cells from WAT. (D) qRT-PCR analysis of surface marker expression after 5-7 days of culture in growth medium (means ± SEM, n=4). (E) Representative images of PDGFRα+ or PDGFRα- cells cultured in the presence of insulin (1μg/mL) for 7 days. Boron-dipyrromethene (BODIPY, red) staining indicates higher insulin-stimulated adipogenesis in PDGFRα+ fractions. (H, I) qRT-PCR analysis on adipocyte gene expression. (F) Expression of adipocyte-specific markers, normalized to that of PDGFRa+ cells. PDGFRα+ cells were significantly more responsive to insulin-induced adipogenesis, compared to PDGFRα- cells (means ± SEM, n=4, Pparg: p=0.002, Fabp4: p=0.004, Plin1: p=0.012, and lipoprotein lipase (Lpl): p=0.0003). (G) Expression of brown adipocyte-specific markers, normalized to levels induced by ISO. Differentiated PDGFRα+ populations (cultured in the presence of Insulin for 7 days) were treated with vehicle (CTL) or isoproterenol (ISO, 10 μM) for 4 h before analysis. (means ± SEM, n=4, Ucp1: p=0.0009, Pgc1: p=0.0003, Dio2: p=0.0095, Ppara: p=0.120). Experiments were repeated 4 times.
Figure 6
Figure 6. PDGFRα+ progenitors contribute to adult white adipogenesis under control conditions and during adipose tissue expansion induced by high fat feeding
(A) Representative images of tdTomato+ cells in eWAT whole mount from control and HFD mice. tdTomato fluorescent images are merged with phase contrast (left) along with a magnified region illustrating tdTomato+ adipocyte clusters (right). (B) Representative images of eWAT paraffin sections double-stained for tdTomato and PLIN1. Images demonstrate abundance of tdTomato+ adipocytes in eWAT from HFD mice. (C) Effect of HFD on the weight of eWAT pads (left) and adipocyte triglyceride content (right). (d) The density of tdTomato+ adipocytes in these pads of mice on chow and HFD. The number of tdTomato+ cells was estimated in eWAT pads and proportion of tdTomato+ adipocytes is expressed as percentage of the total adipocytes. Bar = 100 μm.
Figure 7
Figure 7. In vivo adipogenic potential of FACS-purified PDGFRα expressing progenitors
(A) FACS analysis of PDGFRα+ cells from WAT of GFP transgenic mice. The X-axis indicates PE intensity (PDGFRα expression). Histogram with dashed line represents the negative control for PDGFRα staining. (B) Representative low magnification images of engrafted PDGFRα+ or PDGFRα- cells in Matrigel 4 weeks after transplantation. Bars = 50 μm. GFP (green) fluorescent images were merged with phase contrast (left), nile red fluorescence (middle, red) or Plin1 immunofluorescence (right, red). Images demonstrate abundance of GFP+ adipocytes in PDGFRα+ transplants by native fluorescence in whole mount tissue (left and middle) and by immunostaining on paraffin sections (right). Nuclei were counterstained with DAPI. (C) Quantitative analysis of GFP+ adipocytes. Donor contribution is the percentage of total adipocytes (nile red+, PPARγ+) from the transplant that were donor-derived (GFP+). Values are means ± range for 2 independent experiments (p<0.0001, Fisher’s exact test). (D-E) High magnification images of nile red (left, red) and PPARγ (right, red) in whole mount tissues. Bars = 20 μm.

References

    1. Andrae J, Gallini R, Betsholtz C. Role of platelet-derived growth factors in physiology and medicine. Genes Dev. 2008;22:1276–1312. - PMC - PubMed
    1. Barbatelli G, Murano I, Madsen L, Hao Q, Jimenez M, Kristiansen K, Giacobino JP, De Matteis R, Cinti S. The emergence of cold-induced brown adipocytes in mouse white fat depots is determined predominantly by white to brown adipocyte transdifferentiation. Am. J. Physiol. Endocrinol. Metab. 2010;298:E1244–1253. - PubMed
    1. Cinti S. The adipose organ. Prostaglandins, Leukotrienes and Essential Fatty Acids. 2005;73:9–15. - PubMed
    1. Cinti S. Transdifferentiation properties of adipocytes in the adipose organ. Am. J. Physiol. Endocrinol. Metab. 2009;297:E977–E986. - PubMed
    1. Cousin B, Cinti S, Morroni M, Raimbault S, Ricquier D, Penicaud L, Casteilla L. Occurrence of brown adipocytes in rat white adipose tissue: molecular and morphological characterization. J. Cell Sci. 1992;103:931–942. - PubMed

Publication types

MeSH terms

Substances