Review
. 2012:110:19-56.
doi: 10.1016/B978-0-12-388403-9.00002-3.

Integrated inference and analysis of regulatory networks from multi-level measurements

Affiliations
Review

Integrated inference and analysis of regulatory networks from multi-level measurements

Christopher S Poultney et al. Methods Cell Biol. 2012.

Abstract

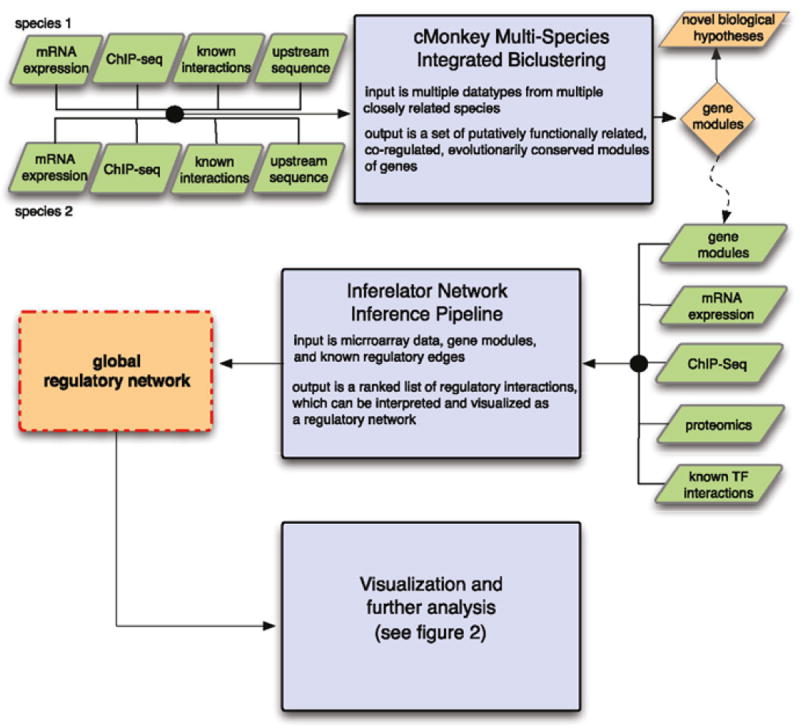
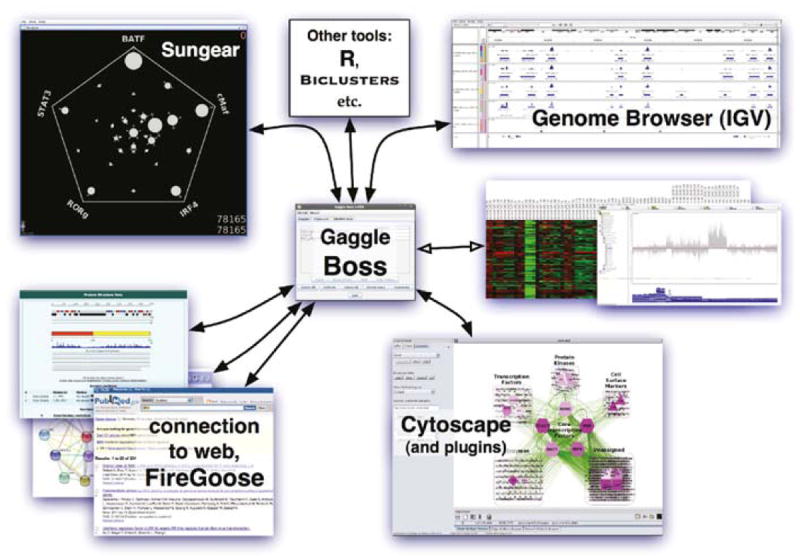
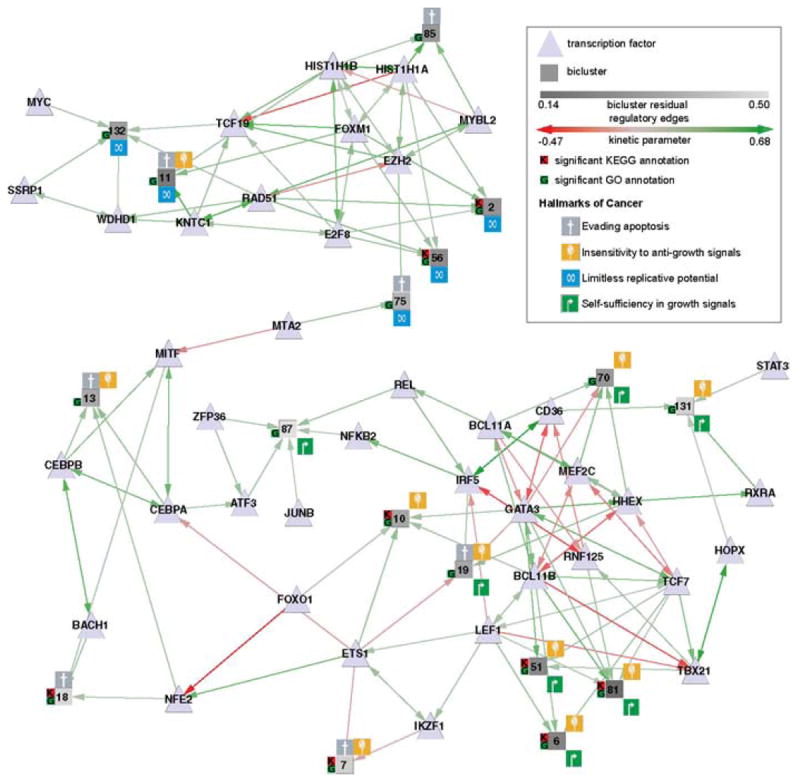
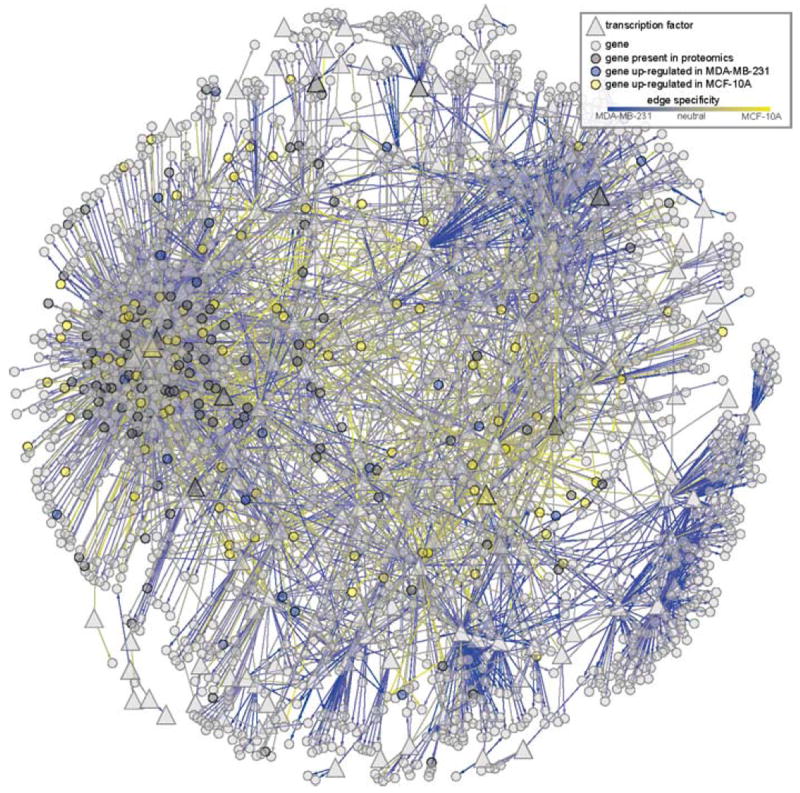
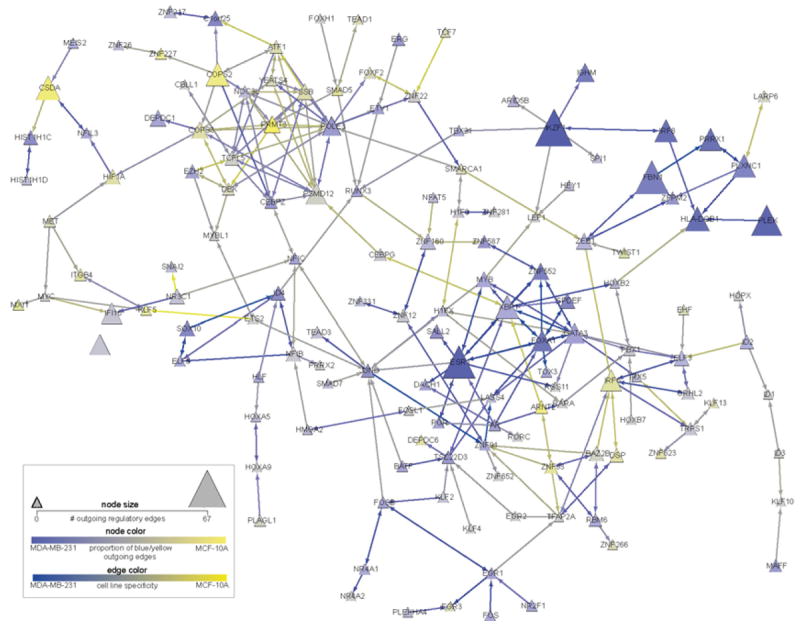
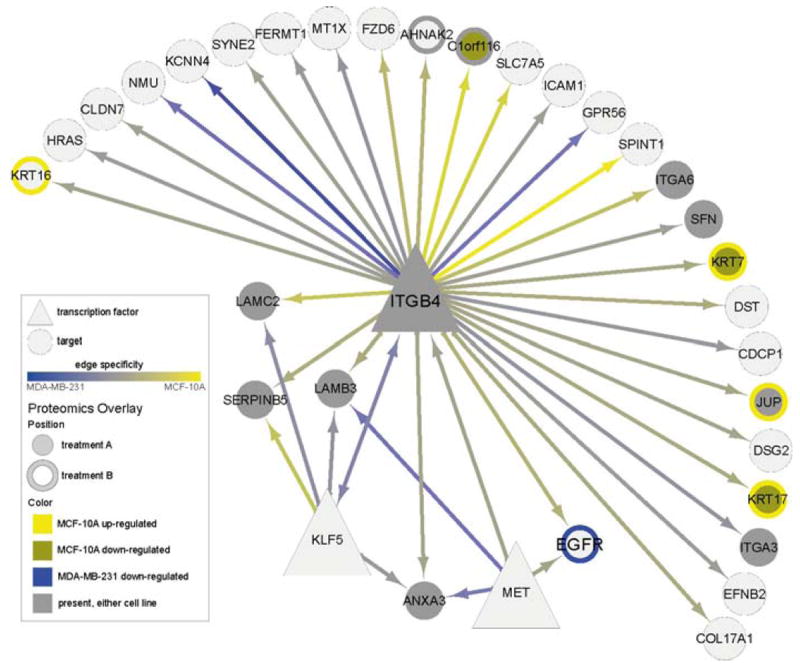
Regulatory and signaling networks coordinate the enormously complex interactions and processes that control cellular processes (such as metabolism and cell division), coordinate response to the environment, and carry out multiple cell decisions (such as development and quorum sensing). Regulatory network inference is the process of inferring these networks, traditionally from microarray data but increasingly incorporating other measurement types such as proteomics, ChIP-seq, metabolomics, and mass cytometry. We discuss existing techniques for network inference. We review in detail our pipeline, which consists of an initial biclustering step, designed to estimate co-regulated groups; a network inference step, designed to select and parameterize likely regulatory models for the control of the co-regulated groups from the biclustering step; and a visualization and analysis step, designed to find and communicate key features of the network. Learning biological networks from even the most complete data sets is challenging; we argue that integrating new data types into the inference pipeline produces networks of increased accuracy, validity, and biological relevance.


Figures

Fig. 1
Fig. 1
Overall inference pipeline. Our inference pipeline is composed of three main steps: (1) inference of biclusters, which are putative functionally related, co-regulated modules of genes, by Multi-species cMonkey (MScM); (2) inference of the regulation of these biclusters by transcription factors (TFs) via our Inferelator inference pipeline; and (3) analysis and visualization using a collection of Gaggle-connected tools. The input to cMonkey consists of mRNA expression data, known as interactions (some of which come from ChIP-seq), and upstream sequence information from two or more species. The output of MScM is biclusters that are conserved between multiple species. These biclusters can be used for hypothesis generation, and also serve as the input to the Inferelator network inference pipeline. Along with biclusters, the Inferelator also uses mRNA expression data, known interactions between relevant TFs and their targets, proteomics data, and ChIP-seq data. The output of the Inferelator inference pipeline is a set of regulatory interactions between the biclusters and TFs. This putative regulatory network can be visualized and analyzed by the Gaggle-connected set of tools shown in Fig. 2. (For color version of this figure, the reader is referred to the web version of this book.)
Fig. 2
Fig. 2
Gaggle visualization and analysis framework. The Gaggle Boss, shown in the center, coordinates communication among the various member tools (geese), removing the need for file import/export and format translation. Also shown is a subset of geese, including two – Cytoscape and Sungear – that are used as part of the analysis discussed in Biological Insights section and Methods section. Each of the geese can both send to and receive from the Boss, which permits an iterative workflow: for example, a small set of genes from Sungear can be sent to Cytoscape, analyzed to find its 1-hop network, then sent back to Sungear for further analysis. In addition, several geese provide extensible means to connect to a larger set of tools: Cytoscape and Sungear via plug-in frameworks, FireGoose via its connections to other websites, and R via its downloadable packages. (For color version of this figure, the reader is referred to the web version of this book.)
Fig. 3
Fig. 3
Hallmarks of cancer shown overlaid on a sub-network of biclusters and transcriptions factors (TFs). Biclusters are shown as squares, with shading indicating the bicluster residual (variance in gene expression values). Surrounding icons indicate the putative hallmarks of cancer. A small K or G to the bicluster left indicates particularly significant enrichment for one or more KEGG or GO terms, respectively. TFs are shown as triangles, with regulatory edges to biclusters and other TFs. Green edges indicate upregulation, and red edges downregulation. Four of the six original hallmarks are represented in the network: biclusters associated with self-sufficiency in growth signals and insensitivity to anti-growth signals are clustered together, as are those associated with limitless replicative potential; biclusters inferred to be involved in evading apoptosis are spread through the network. (See color plate)
Fig. 4
Fig. 4
Breast cancer network with the top 4822 edges ranked by combined confidence from the two cell line inference runs. Edge color denotes differential inferred regulation on a yellow-to-blue gradient from MCF-10A (yellow) to MDA-MB-231 (blue). Nodes are rendered semi-transparent so that the distribution of cell-line-specific regulatory edges can be clearly seen. Proteomics data from MCF-10A/MDA-MB-231 comparison are also shown using node colors: differential expression in MCF-10A is shown in yellow, and MDA-MB-231 in blue. Genes present but not differentially expressed are shown in darker gray. (See color plate)
Fig. 5
Fig. 5
Largest connected sub-network of transcription factors (TFs) from the overall cell line comparison network. A “summary” of the entire network is provided by (a) hiding all targets of the shown TFs that are not themselves TFs, and (b) setting the size and color of each remaining TF node to reflect its number and proportion of cell-line-specific edges. Node size shows the number of edges in the master network that were above a cutoff for specificity to either cell line. Larger nodes have more cell-line-specific edges; the largest, IKZF1, has 67 edges above the threshold. Node color is determined by the ratio of above-cutoff edges specific to MCF-10Aversus MDA-MB-231, with yellow denoting more MCF-10A edges and blue more MDA-MB-231 edges. Nodes with many edges specific to one cell line or the other are therefore large and brightly colored, such as IKZF1 or COPS2. Edges are colored on a yellow-to-blue gradient based on the inferred confidence of the edge in the MCF-10A cell line (yellow) or MDA-MB-231 cell line (blue). (See color plate)
Fig. 6
Fig. 6
A sub-network extracted from the cell line comparison network illustrating all interactions with ITGB4 along with overlays of experimental proteomics (SILAC) data. Shown is the 1-hop network from gene ITGB4 along with differential expression in two experimental conditions, referred to as treatment A and treatment B. ITGB4 was identified a priori as a gene of interest, and is inferred to regulate gene of interest EGFR and several Laminins. Differential expression in treatment A is shown using node center, and in treatment B using node border, as follows: bright yellow denotes upregulation in MCF-10A, bronze denotes downregulation in MCF-10A, and blue denotes downregulation in MDA-MB-231. Gray denotes proteins that were present in either cell line but that did not meet the differential expression cutoff. Therefore, KRT17 (bottom right) is downregulated in MCF-10A with treatment A but upregulated in MCF-10A with treatment B, while EGFR is downregulated in MDA-MB-231 with treatment B. Edge colors are as in Fig. 5. (See color plate)

References

    1. Aranda B, Achuthan P, Alam-Faruque Y, Armean I, Bridge A, Derow C, Feuermann M, Ghanbarian AT, Kerrien S, Khadake J, Kerssemakers J, Leroy C, Menden M, Michaut M, Montecchi-Palazzi L, Neuhauser SN, Orchard S, Perreau V, Roechert B, van Eijk K, Hermjakob H. The IntAct molecular interaction database in 2010. Nucleic Acids Res. 2010;38:D525–D530. - PMC - PubMed
    1. Ashburner M, Ball CA, Blake J, ABotstein D, Butler H, Cherry JM, Davis AP, Dolinski K, Dwight SS, Eppig JT, Harris MA, Hill DP, Issel-Tarver L, Kasarskis A, Lewis S, Matese JC, Richardson JE, Ringwald M, Rubin GM, Sherlock G. Gene ontology: tool for the unification of biology. The Gene Ontology Consortium. Nat Genet. 2000;25:25–29. - PMC - PubMed
    1. Bader GD, Betel D, Hogue CW. BIND: the Biomolecular Interaction Network Database. Nucleic Acids Res. 2003;31:248–250. - PMC - PubMed
    1. Bailey TL, Elkan C. Fitting a mixture model by expectation maximization to discover motifs in biopolymers. Int Conf Intell Syst Mol Biol; Proceedings /.. International Conference on Intelligent Systems for Molecular Biology; ISMB; 1994. pp. 28–36. - PubMed
    1. Bailey TL, Gribskov M. Combining evidence using p-values: application to sequence homology searches. Bioinformatics. 1998;14:48–54. - PubMed

LinkOut - more resources