. 2012 Apr 4;20(4):604-17.
doi: 10.1016/j.str.2012.02.001. Epub 2012 Apr 3.

Solution structure analysis of the HPV16 E6 oncoprotein reveals a self-association mechanism required for E6-mediated degradation of p53

Affiliations

Solution structure analysis of the HPV16 E6 oncoprotein reveals a self-association mechanism required for E6-mediated degradation of p53

Katia Zanier et al. Structure. .

Abstract

The viral oncoprotein E6 is an essential factor for cervical cancers induced by "high-risk" mucosal HPV. Among other oncogenic activities, E6 recruits the ubiquitin ligase E6AP to promote the ubiquitination and subsequent proteasomal degradation of p53. E6 is prone to self-association, which long precluded its structural analysis. Here we found that E6 specifically dimerizes through its N-terminal domain and that disruption of the dimer interface strongly increases E6 solubility. This allowed us to raise structural data covering the entire HPV16 E6 protein, including the high-resolution NMR structures of the two zinc-binding domains of E6 and a robust data-driven model structure of the N-terminal domain homodimer. Interestingly, homodimer interface mutations that disrupt E6 self-association also inactivate E6-mediated p53 degradation. These data suggest that E6 needs to self-associate via its N-terminal domain to promote the polyubiquitination of p53 by E6AP.


Figures

Figure 1
Figure 1
Dimerization of the HPV16 E6N domain. (A) Superimposition of a region of the 1H-15N HSQC spectra of the wild-type HPV16 E6N domain measured at concentrations of 25 (red), 50 (magenta), 100 (violet), 200 (blue) and 300 (black) μM. Amide groups undergoing significant shifts are labelled. (B) Molecular weight distribution of wild-type and F47R HPV16 E6N constructs derived from sedimentation velocity ultracentrifugation experiments. The molecular weights of E6N monomeric (E6N) and dimeric ((E6N)2) species are indicated. C(M) indicates arbitrary units. (C) Estimation of the equilibrium affinity constant (KD) of wild-type HPV16 E6N dimerization. The sum of the chemical shift changes from four selected amide cross-peaks (belonging to residues H24, E41, D44, F47) are plotted against the total concentration of the E6N domain. Δδ = (10*(δH−δH0)2 + ((δN−δN0)2)1/2 where δH and δN are the proton and nitrogen chemical shifts of each residue, while δH0 and δN0 are the proton and nitrogen chemical shifts at 25 μM. The KD value derived from the fit corresponds to 290 ± 120 μM. (D) Chemical shift perturbations induced by dilution of the wt E6N sample (wt E6N at 300 μM versus 150 μM) (upper plot) and introduction of the F47R mutation (corresponding to chemical shift differences between wtE6N at 300 μM versus E6N F47R) (lower plot). The y-axis of the lower plot has been inverted for clarity. Δδ is a composite shift obtained by combining on a per-residue basis the chemical shift changes for all assigned 1H, 13C and 15N. Composite Δδ=1N(i=1NΔνi2σi)2 where N is the number of nuclei, Δν is the chemical shift displacement and σ is the spectral dispersity factor of each nucleus derived from the BMRB data bank. Residues undergoing chemical shift displacements ≥ 0.0075 ppm upon wt E6N dilution or ≥0.050 ppm upon introduction of the F47R mutation are indicated. Secondary structure elements are derived from the 3D structure of the E6N F47R domain (see Figure 2). The colour coding of secondary structure elements will be retained in subsequent figures. See also Figure S1.
Figure 2
Figure 2
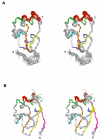
NMR ensembles of the E6 domain structures. Stereo views of the 20 lowest energy structures of E6N F47R (residues 1-71) (A) and E6C 4C/4S (residues 80-143) (B). Zinc atoms are represented as grey spheres. Figures of the molecular structures were made using PyMOL (DeLano). See also Figure S2.
Figure 3
Figure 3
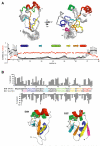
Structure and dynamic properties of the monomeric HPV16 E6 zinc-binding domains. (A) (Upper panel) Ensemble of the 20 lowest energy structures of E6N F47R. The right hand view shows the anchoring residue F2 and other hydrophobic core residues displaying NOE contacts with F2. (Lower panel) Heteronuclear NOE (red circles) and average pairwise backbone r.m.s. deviations (black circles) values for the E6N F47R domain. R.m.s. deviations have been calculated over five residue segments of the primary sequence for the 20 lowest energy NMR structures and error bars represent standard deviations of the mean. Black stars on the x-axis mark proline residues. (B) Structural homology of the E6N and E6C domains (Upper panel) Percentage of exposure to the solvent of residues in the lowest energy NMR structures of E6N F47R and E6C-4C/4S constructs. The y-axis of the E6C plot has been inverted for clarity. Numbers on the x-axis correspond to the wild-type HPV16 E6 sequence. The amino acid sequence of each domain is aligned with the x-axis and coloured to mark secondary structure elements. Zinc coordinating cysteines are underligned, while exposure values for non-conserved cysteines are indicated by arrows. Asterisks indicate sites of mutations. (Lower panel) Ribbon representations of the lowest energy NMR structures of the E6N F47R (left) and E6C 4C/4S (right) constructs. Zinc atoms and coordinating cysteine side-chains are displayed. See also Figure S3.
Figure 4
Figure 4
Model structure of the HPV16 E6N homodimer. (A) (Left panel) Ribbon representation of the lowest energy structure in cluster 1. (Right panel) Views of the homodimer interface. The top representation illustrates the side-chain orientation of interacting residues. The bottom representation illustrates the positioning of the aromatic ring F47 (violet) in the shallow hydrophobic pocket (green) within the opposing subunit. (B) Alignment of E6N sequences of representative strains from the “high-risk” mucosal HPV A9 and A7 groups, the low-risk mucosal A10 group, the “high-risk” cutaneous B1A1 group and two BPV strains. Residues reported to undergo the largest chemical shift variations in Figure 1D are coloured according to their physicochemical properties as follows: magenta, hydrophobic (W, F, Y, L, I, V, M); green, basic (K, R, H); red, acidic (E, D); orange, polar (Q, N, T, S); brown, cystein (C); cyan, small (G, A, P). (C) (Left panel) Molecular weight distribution of wild-type HPV5, HPV18 and BPV1 E6N domain constructs derived from sedimentation velocity ultracentrifugation experiments. (Right panel) Analytical gel filtration chromatography analysis of affinity purified HPV11 MBP-E6N fusion construct. Samples were adjusted at the concentrations indicated and injected on a Superdex 200 10/30 column. The elution volumes of the monomeric (MBP-E6N, 55.2 kDa) and dimeric ((MBP-E6N)2, 110.4 kDa) species are indicated. The shoulder at 14.1 ml corresponds to MBP arising from residual proteolytic activity in the preparations. Molecular size markers are reported on top of the figure. “1,” V0; “2,” ferritin (440 kDa); “3,” mouse immunoglobulin G (150 kDa); “4,” bovine serum albumin (67 kDa); “5,” ovoalbumin (43 kDa); “6,” RNase (13.7 kDa). See also Figure S4.
Figure 5
Figure 5
Mutations at the E6N homodimer interface enhance full-length E6 solubility. (A) Homodimer interface mutations have been introduced in the context of HPV16 E6N domain construct and the resulting samples have been analyzed by sedimentation velocity ultracentrifugation experiments. The profile of the wild-type domain is reported on each plot for clarity. (B) Concentrations thresholds of samples of full-length E6 mutants. Homodimer interface mutations have been introduced in the HPV16 E6 4C/4S construct. (C) 1H, 15N HSQC spectra of the E6 F47R 4C/4S construct. (Left panel) Superposition of spectra of E6 F47R 4C/4S (black), E6N F47R (cyan) and E6C 4C/4S (red) constructs. Magenta arrows indicate amide groups belonging to residues 1-10 and 80-90. (Right panel) Annotated 1H, 15N HSQC of E6 F47R 4C/4S. Assignments are shown in red. See also Figure S5.
Figure 6
Figure 6
p53 degradation activities of HPV16 E6 homodimer interface mutants. (A) In vitro p53 degradation reactions employing in vitro translated and 35S labelled proteins. Assays were performed by incubating 2 μl of 35S p53 translation product with varying amounts of 35S E6 translation products. In the input control the reaction was stopped immediately after mixing p53 and E6 by addition of loading buffer. (Left panel) Partial views of the autoradiographs showing the p53 double band after incubation with different amounts of the E6 mutants. For clarity, the E6 bands for each of the p53 degradation reactions are shown separately in Figure S6B. Lane 1 (L1): input; L2: 5 μl E6; L3: 2.5 μl E6; L4: 1.25 μl E6; L5: 0.75 μl E6; L6: 0.37 μl E6. (Right panel) Plot summarizing the in vitro p53 degradation profiles of the different E6 mutants. The p53 degradation activity is represented as (I0-I)/I0 where I is the intensity of the p53 double band after incubation with E6 while I0 p53 signal in the input lane. Error bars represent standard deviations from three independent experiments. (B) Double immunofluorescence of E6 and p53 in C33A cells after transfection with wt E6 or E6 mutants. Observation of p53 and E6 was achieved by incubating cells first with the anti-p53 antibody and then with the anti-E6 antibody. The disappearance of the red p53 signal in E6 transfected cells displaying a green signal indicates E6 mediated p53 degradation. (C) Correlation of p53 degradation activities and solubility thresholds of the different E6 mutants. The (I0-I5μl)/I0 ratio refers to the in vitro p53 degradation in the presence of 5 μl of E6. See also Figure S6.
Figure 7
Figure 7
Putative model of the E6/E6AP/p53 trimery complex. At the center the ribbon representation of a symmetric dimer of E6 mediated by the E6N domains. The two subunits of the dimer are shown in green and violet respectively. The relative orientation of the E6N and E6C domains is arbitrary. Each E6 molecule binds to one molecule of E6AP (yellow cartoon) and one molecule of p53 (pink cartoon). In this model, only ubiquitin transfer events are possible that originate between E6AP and p53 molecules loaded on different subunits of the E6 dimer.

References

    1. Bosch FX, Manos MM, Munoz N, Sherman M, Jansen AM, Peto J, Schiffman MH, Moreno V, Kurman R, Shah KV, International biological study on cervical cancer (IBSCC) Study Group Prevalence of human papillomavirus in cervical cancer: a worldwide perspective. J. Natl. Cancer Inst. 1995;87:796–802. - PubMed
    1. Brimer N, Lyons C, Vande Pol SB. Association of E6AP (UBE3A) with human papillomavirus type 11 E6 protein. Virology. 2007;358:303–310. - PMC - PubMed
    1. Camus S, Menendez S, Cheok CF, Stevenson LF, Lain S, Lane DP. Ubiquitin-independent degradation of p53 mediated by high-risk human papillomavirus protein E6. Oncogene. 2007;26:4059–4070. - PMC - PubMed
    1. Chakrabarti O, Krishna S. Molecular interactions of ‘high-risk’ human papillomaviruses E6 and E7 oncoproteins: implications for tumour progression. J. Biosci. 2003;28:337–348. - PubMed
    1. Chen JJ, Hong Y, Rustamzadeh E, Baleja JD, Androphy EJ. Identification of an alpha helical motif sufficient for association with papillomavirus E6. J. Biol. Chem. 1998;273:13537–13544. - PubMed

Publication types

MeSH terms