

Measuring functional connectivity in MEG: a multivariate approach insensitive to linear source leakage
- PMID: 22484306
- PMCID: PMC3459100
- DOI: 10.1016/j.neuroimage.2012.03.048
Measuring functional connectivity in MEG: a multivariate approach insensitive to linear source leakage
Abstract
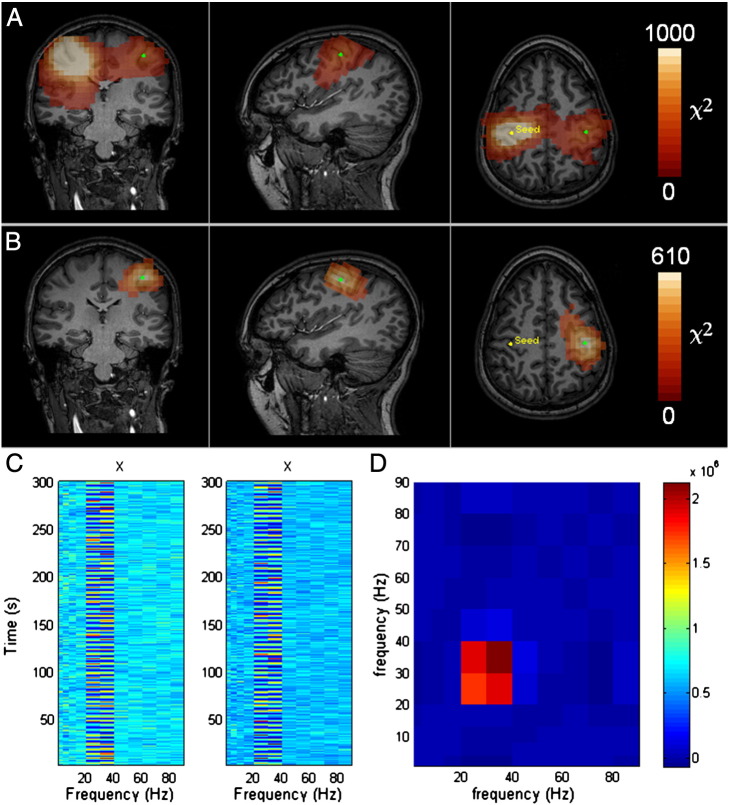
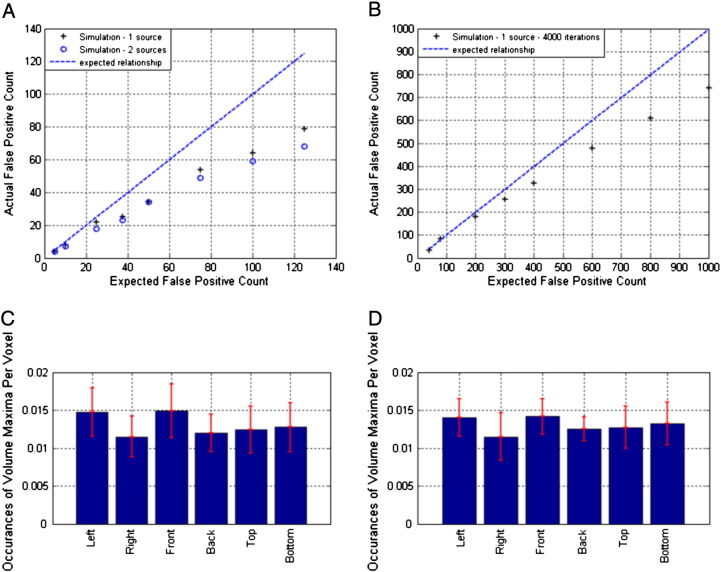
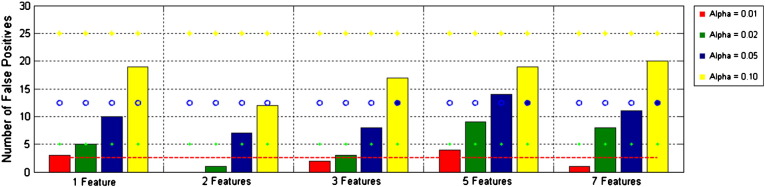
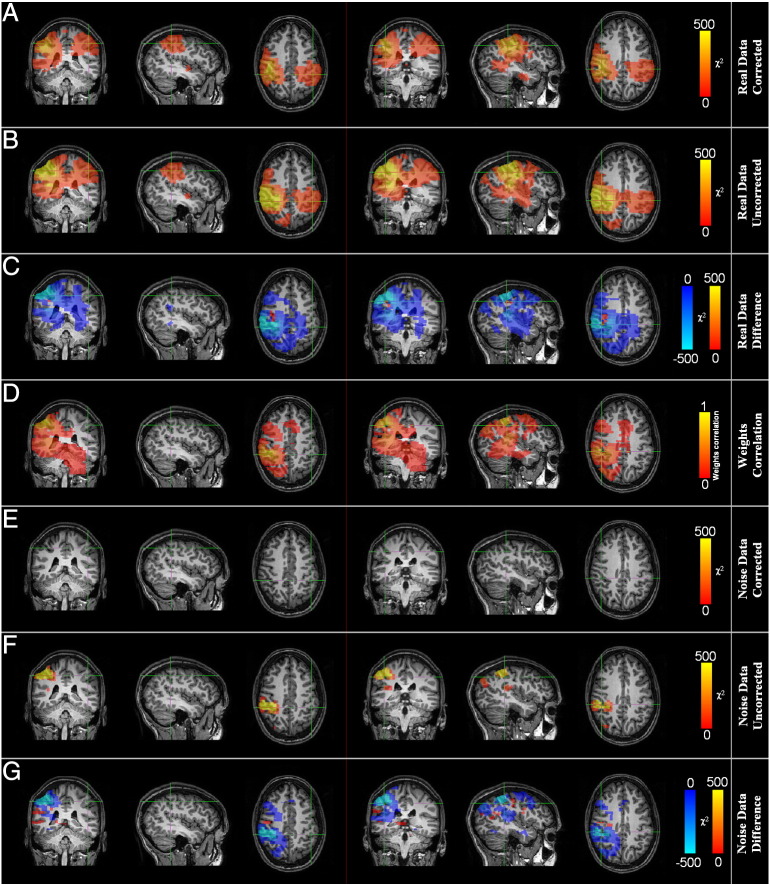
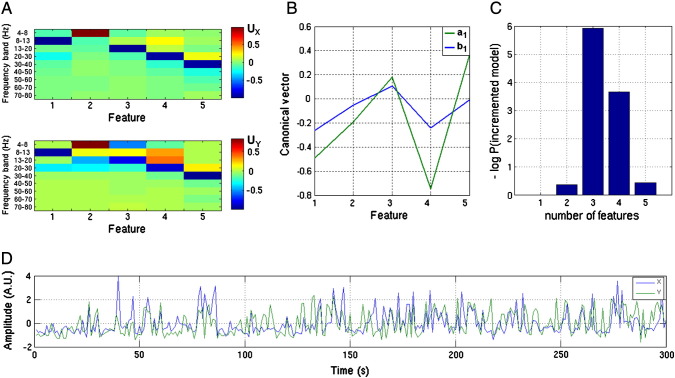
A number of recent studies have begun to show the promise of magnetoencephalography (MEG) as a means to non-invasively measure functional connectivity within distributed networks in the human brain. However, a number of problems with the methodology still remain--the biggest of these being how to deal with the non-independence of voxels in source space, often termed signal leakage. In this paper we demonstrate a method by which non-zero lag cortico-cortical interactions between the power envelopes of neural oscillatory processes can be reliably identified within a multivariate statistical framework. The method is spatially unbiased, moderately conservative in false positive rate and removes linear signal leakage between seed and target voxels. We demonstrate this methodology in simulation and in real MEG data. The multivariate method offers a powerful means to capture the high dimensionality and rich information content of MEG signals in a single imaging statistic. Given a significant interaction between two areas, we go on to show how classical statistical tests can be used to quantify the importance of the data features driving the interaction.
Copyright © 2012 Elsevier Inc. All rights reserved.
Figures
Similar articles
-
The impact of MEG source reconstruction method on source-space connectivity estimation: A comparison between minimum-norm solution and beamforming.Neuroimage. 2017 Aug 1;156:29-42. doi: 10.1016/j.neuroimage.2017.04.038. Epub 2017 May 4. Neuroimage. 2017. PMID: 28479475
-
Measuring the cortical correlation structure of spontaneous oscillatory activity with EEG and MEG.Neuroimage. 2016 Apr 1;129:345-355. doi: 10.1016/j.neuroimage.2016.01.055. Epub 2016 Jan 28. Neuroimage. 2016. PMID: 26827813
-
Phase shift invariant imaging of coherent sources (PSIICOS) from MEG data.Neuroimage. 2018 Dec;183:950-971. doi: 10.1016/j.neuroimage.2018.08.031. Epub 2018 Aug 22. Neuroimage. 2018. PMID: 30142449
-
How can intracranial recordings assist MEG source localization?Neurol Clin Neurophysiol. 2004 Nov 30;2004:86. Neurol Clin Neurophysiol. 2004. PMID: 16012657 Review.
-
Measuring electrophysiological connectivity by power envelope correlation: a technical review on MEG methods.Phys Med Biol. 2015 Nov 7;60(21):R271-95. doi: 10.1088/0031-9155/60/21/R271. Epub 2015 Oct 8. Phys Med Biol. 2015. PMID: 26447925 Review.
Cited by
-
Using structural connectivity to augment community structure in EEG functional connectivity.Netw Neurosci. 2020 Aug 1;4(3):761-787. doi: 10.1162/netn_a_00147. eCollection 2020. Netw Neurosci. 2020. PMID: 32885125 Free PMC article.
-
The Effect of Common Signals on Power, Coherence and Granger Causality: Theoretical Review, Simulations, and Empirical Analysis of Fruit Fly LFPs Data.Front Syst Neurosci. 2018 Jul 25;12:30. doi: 10.3389/fnsys.2018.00030. eCollection 2018. Front Syst Neurosci. 2018. PMID: 30090060 Free PMC article.
-
Dynamic large-scale network synchronization from perception to action.Netw Neurosci. 2018 Oct 1;2(4):442-463. doi: 10.1162/netn_a_00039. eCollection 2018. Netw Neurosci. 2018. PMID: 30320293 Free PMC article.
-
Beta resting-state functional connectivity predicts tactile spatial acuity.Cereb Cortex. 2023 Aug 8;33(16):9514-9523. doi: 10.1093/cercor/bhad221. Cereb Cortex. 2023. PMID: 37344255 Free PMC article.
-
Functional connectivity disruptions correlate with cognitive phenotypes in Parkinson's disease.Neuroimage Clin. 2017 Mar 6;14:591-601. doi: 10.1016/j.nicl.2017.03.002. eCollection 2017. Neuroimage Clin. 2017. PMID: 28367403 Free PMC article.
References
-
- Brookes M.J., Vrba J., Robinson S.E., Stevenson C.M., Peters A.P., Barnes G.R., Hillebrand A., Morris P.G. Optimising experimental design for MEG beamformer imaging. NeuroImage. 2008;39:1788–1802. - PubMed
Publication types
MeSH terms
Grants and funding
LinkOut - more resources
Full Text Sources
