. 2012 Apr 8;19(5):538-46, S1.
doi: 10.1038/nsmb.2278.

ATP binding controls distinct structural transitions of Escherichia coli DNA gyrase in complex with DNA

Affiliations

ATP binding controls distinct structural transitions of Escherichia coli DNA gyrase in complex with DNA

Aakash Basu et al. Nat Struct Mol Biol. .

Abstract

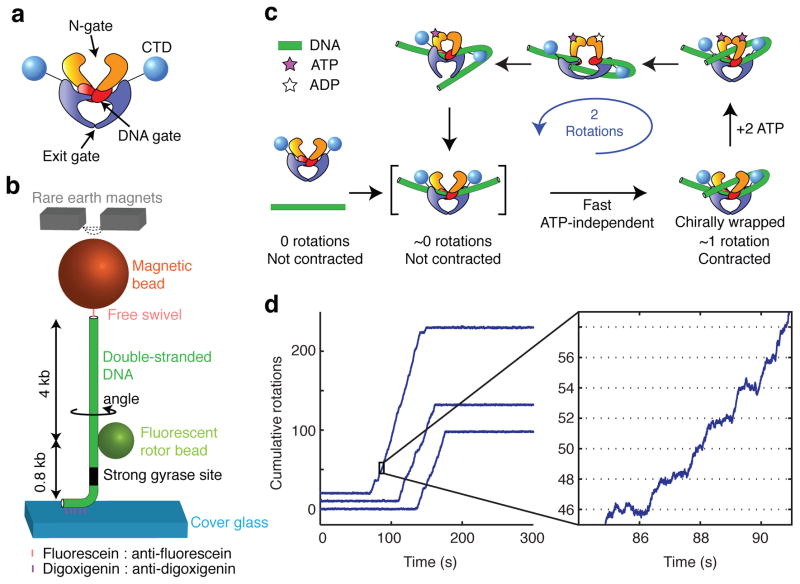
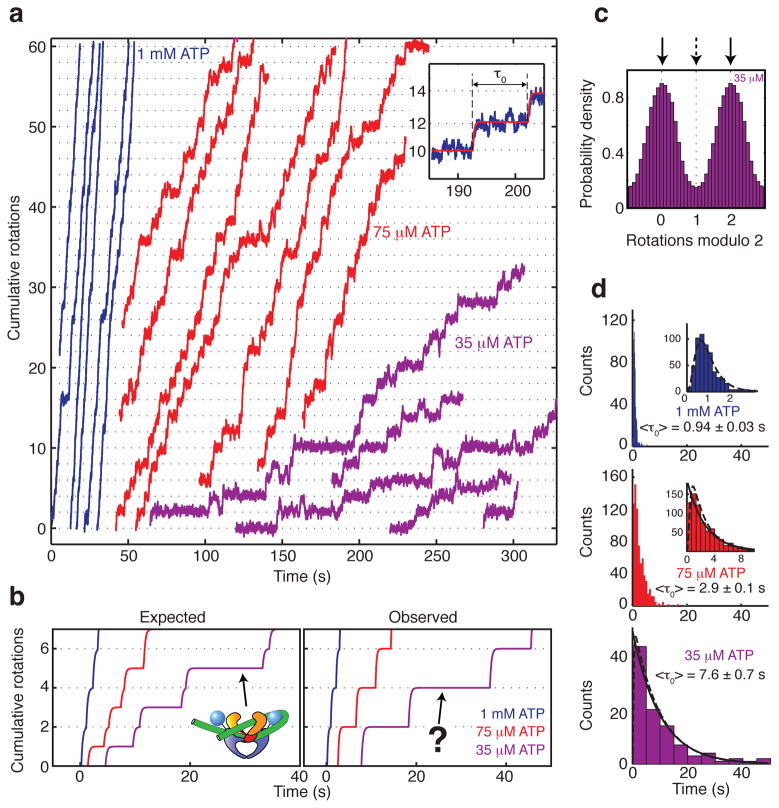
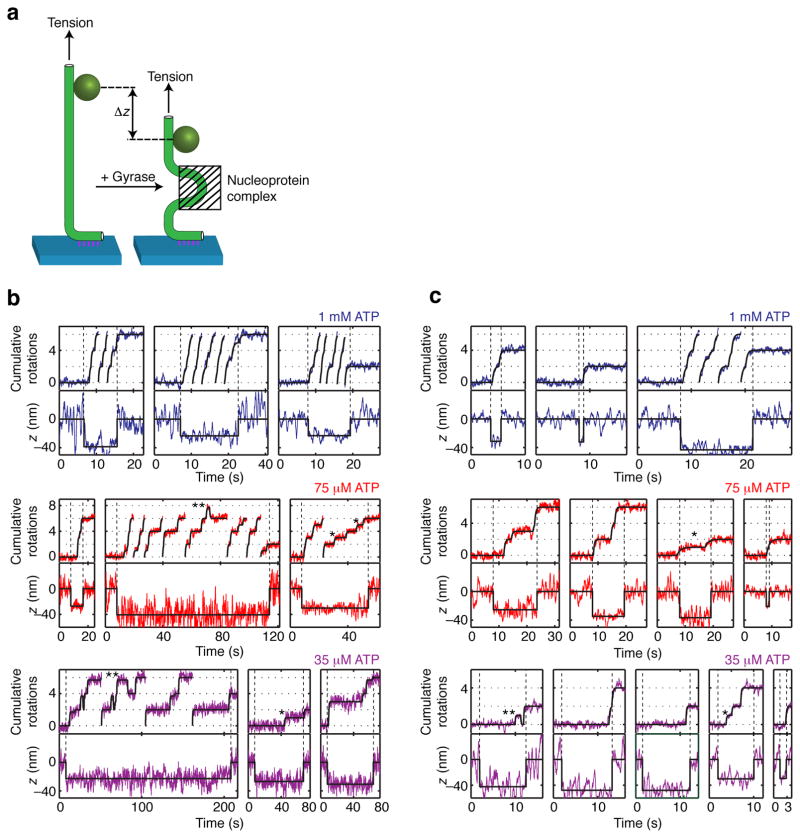
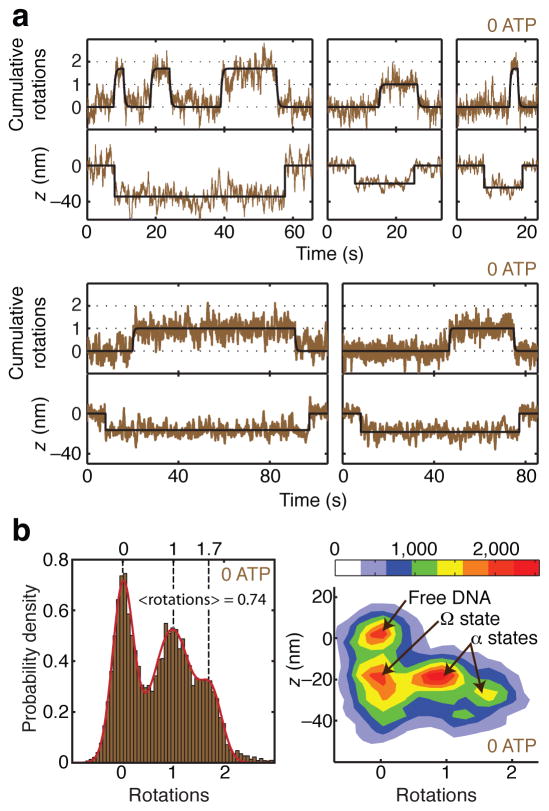
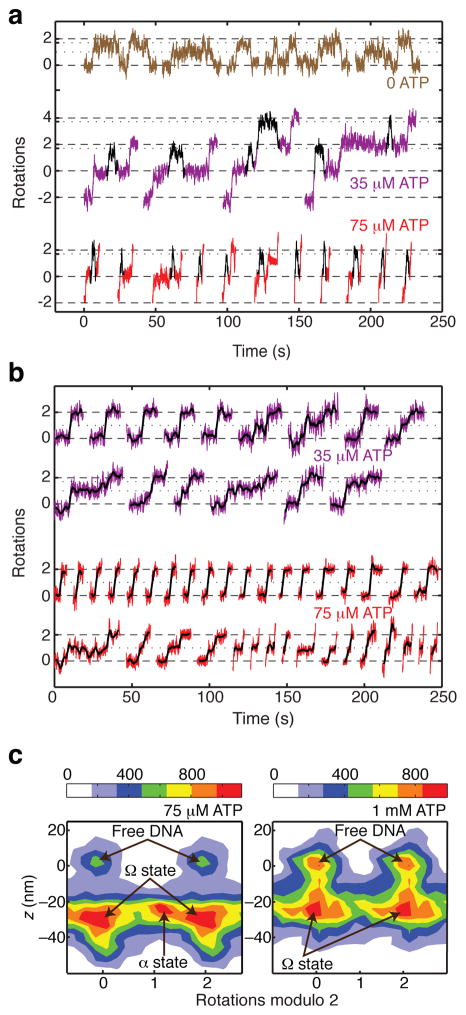
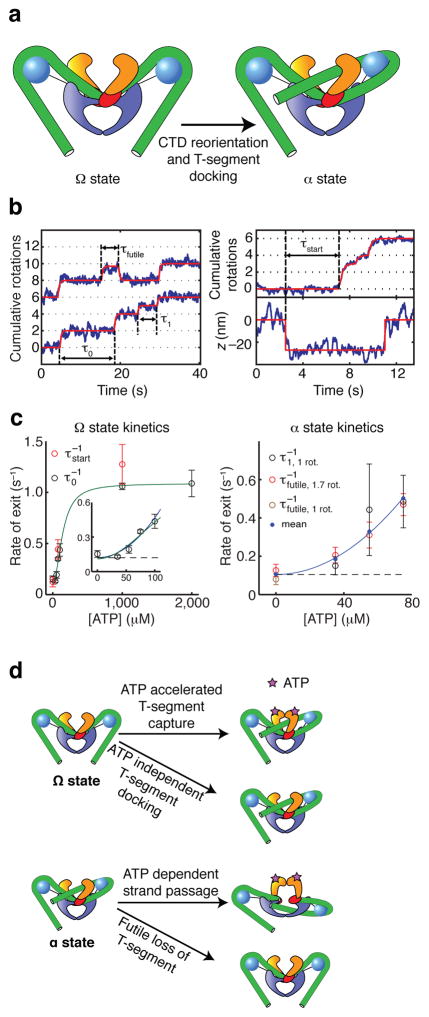
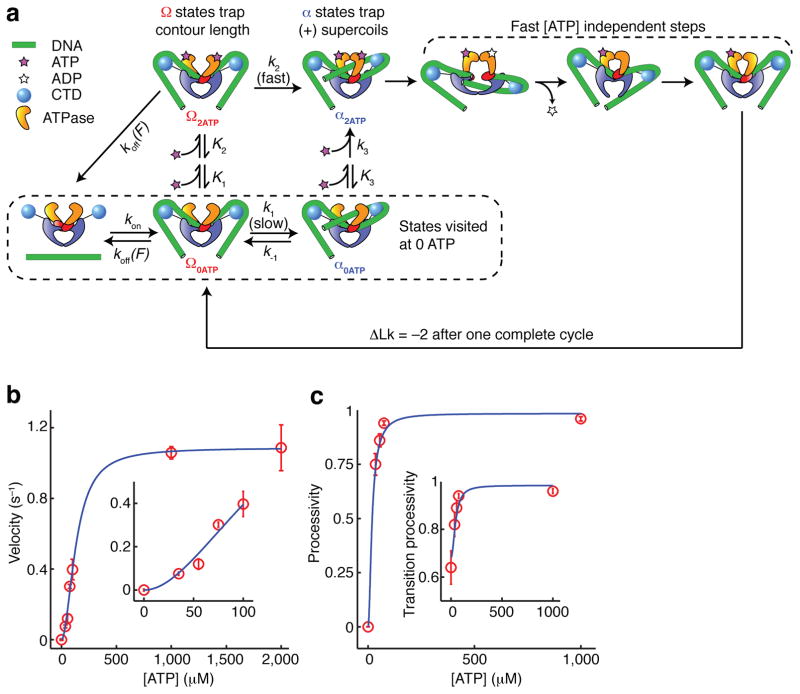
DNA gyrase is a molecular motor that harnesses the free energy of ATP hydrolysis to introduce negative supercoils into DNA. A critical step in this reaction is the formation of a chiral DNA wrap. Here we observe gyrase structural dynamics using a single-molecule assay in which gyrase drives the processive, stepwise rotation of a nanosphere attached to the side of a stretched DNA molecule. Analysis of rotational pauses and measurements of DNA contraction reveal multiple ATP-modulated structural transitions. DNA wrapping is coordinated with the ATPase cycle and proceeds by way of an unanticipated structural intermediate that dominates the kinetics of supercoiling. Our findings reveal a conformational landscape of loosely coupled transitions funneling the motor toward productive energy transduction, a feature that may be common to the reaction cycles of other DNA and protein remodeling machines.


Figures

Figure 1
Figure 1
Single molecule assay for DNA gyrase activity. (a) Diagram of the gyrase tetramer showing approximate relationships between protein domains as described in the text. (b) Schematic of the rotor bead tracking (RBT) assay. The DNA template was stretched using magnetic tweezers, and the fluorescent rotor bead (diameter: ~300 nm) was imaged from below at 250 frames per second. (c) Mechanochemical model based on earlier work,. The expected positions of intermediates are indicated along the repeating two-rotation reaction coordinate probed by the RBT assay. (d) Plots of cumulative rotor angle acquired under 0.5 pN tension after the introduction of DNA gyrase and 1 mM ATP. Long periods of inactivity are interrupted by processive bursts of directional rotation, always in multiples of two rotations. The mean waiting time between presumptive single-enzyme bursts under these conditions was 825 ± 30 s (mean ± SEM). Detailed stepping behavior (seen in the expanded view) can be analyzed for each processive burst. At 1 mM ATP, pauses can be resolved at a spacing of two rotations (dotted lines) in phase with the 0 rotation mark established prior to enzyme binding.
Figure 2
Figure 2
[ATP]-dependent pausing in gyrase stepping traces. All data are taken from processive bursts of gyrase activity at 0.5 pN tension. (a) Cumulative rotations as a function of time with different concentrations of ATP. Traces were fit to a stepwise model (inset; see Methods) to obtain the duration τ0 of each pause. (b) Stepwise fits to observed data are compared with a previous model, which predicted that lowering [ATP] should specifically lengthen a midcycle pause at ~1 rotation. (c) Periodic histogram of rotor angles during processive activity in limiting (35 μM) ATP. Angles are plotted modulo 2 rotations, with 0 defined as the mean angle of the rotor prior to enzyme activity. Solid arrows mark the dominant pause at ~0 rotations; dashed arrow marks the expected intermediate location. (d) Waiting time histograms compiled from a total of 570 pauses at 1 mM ATP, 740 pauses at 75 μM ATP, and 97 pauses at 35 μM ATP. Solid lines are exponential functions with decay times equal to <τ0>. Dashed lines are fits to a multistep model (see Methods) in which [ATP]-independent processes occupy a substantial fraction of the waiting time at 1 mM ATP.
Figure 3
Figure 3
Simultaneous measurements of DNA rotation and contraction. (a) Changes in z reflect changes in overall DNA extension due to formation or rearrangement of a nucleoprotein complex. Simultaneous measurements of angle and z taken under (b) 0.5 pN or (c) 1 pN tension show that the DNA extension becomes contracted upon gyrase binding and remains contracted throughout processive bursts of activity. Traces that reach the top of the angle axis are continued from the bottom of the axis. Solid black lines show stepwise fits (see Methods). Contraction persists during the dominant [ATP]-dependent pause at 0 rotations as well as during secondary pauses at ~1 rotation (examples marked with *) and reversible excursions to ~1.7 rotations (examples marked with **). Contraction precedes angular rotation at the start of processive bursts, as indicated by the vertical dashed lines.
Figure 4
Figure 4
Distinct conformations of the nucleotide-free complex. (a) Measurements of angle and z during gyrase binding events in the absence of ATP, showing transitions between three distinct contracted states. Contraction initially occurs without rotation, and the rotor subsequently makes long-lived excursions to ~1 rotation and ~1.7 rotations. (b) Histograms of angle and z during gyrase binding events in the absence of ATP, comprising 41 reversible excursions. For the 1D histogram, only portions of the rotor trace showing z contraction were selected for analysis. Solid line shows a fit to the sum of three Gaussians centered at ~0 rotations, ~1 rotation, and ~1.7 rotations. The mean angle is 0.74 ± 0.07 rotations (error estimated as SEM of waiting angles based on N=87 dwells). For the 2D histogram of paired (angle, z) data, z contraction events were included along with 2000 frames (8 s) of flanking data on either side of each event, yielding a distinct population corresponding to enzyme-free DNA. The newly identified Ω state, which is contracted in z but does not trap supercoils, can be distinguished from states (designated α) that trap positive supercoils. The legend shows the correspondence between color coding and histogram counts, where each count represents a data point from a 4 ms frame.
Figure 5
Figure 5
[ATP]-dependent dwells in supercoil-trapping intermediates. (a) Excised regions of rotor traces showing reversible excursions to ~1.7 rotations at 35 and 75 μM ATP. Excursions are highlighted in black. The duration of excursions is reduced at higher [ATP]. (b) Excised steps from rotor traces, showing midcyle pauses at low [ATP]. Raw data are overlaid with averaged traces (2 s rolling window). Examples of steps are shown with either no detectable pause, a midcycle pause at ~1 rotation, or a midcycle pause at ~1.7 rotations. Pauses at ~1.7 rotations are rarely long enough to be discriminated from the subsequent plateau at our spatiotemporal resolution. (c) Two-dimensional histograms of paired (angle, z) data, taken from processive runs at 0.5 pN tension (comprising a total of 261 steps at 1 mM ATP and 118 steps at 75 uM ATP) together with flanking regions of inactivity (800 frames on either side of each event at 1 mM ATP, and 1500 frames on either side of each event at 75 μM ATP). At both ATP concentrations, populations can be distinguished corresponding to enzyme-free DNA and the contracted Ω state. At low [ATP], an additional population can be distinguished intermediate between 0 and 2 rotations, as expected for midcycle α states that trap positive supercoils. The mean contraction observed for a given event was 27 ± 2 nm (mean ± SEM) at 1 mM ATP, and 30 ± 2 nm (mean ± SEM) at 75 μM ATP. The legend shows the correspondence between color coding and histogram counts, where each count represents a data point from a 4 ms frame.
Figure 6
Figure 6
Structure and kinetics of intermediates. (a) Cartoons showing hypothetical conformations of the nucleoprotein complex (see also Supplementary Figure 1). In the Ω state, the DNA (green tube) makes extensive contacts with the CTDs but does not form a chiral loop, explaining the absence of supercoil trapping. Ω can be converted to the previously proposed chirally wrapped α states via reorientation of a CTD and docking of a T-segment between the ATPase domains, trapping positive writhe. (b) Stepwise fits (solid lines) to angle and z traces were used to extract four categories of dwell times. Durations were determined as illustrated for dominant pauses (τ0), midcycle pauses (τ1), reversible excursions (τfutile), and lag times between contraction and rotation at the start of processive bursts (τstart). (c) [ATP]-dependent kinetics of α and Ω states. Error bars indicate SEM. <τ0> and <τstart> are similar for all [ATP], as expected if both measurements reflect the lifetime of the Ω state. <τ1> and <τfutile> are also similar for all [ATP], as expected if both measurements reflect the lifetime of the α state. Ω state kinetics saturate at high [ATP] (solid green line; see Supplementary Notes). At low [ATP], the [ATP] dependence of exit rates from both the α state and the Ω state can be approximated by a parabola (solid blue line) with a non-zero intercept (dashed line), as expected for models (d) in which an ATP-independent process competes with a process requiring two ATP molecules. The kinetics of the Ω state are explained by a model in which T-segment docking can occur via either a slow ATP-independent process or an ATP-accelerated process requiring 2 ATP. Similarly, the kinetics of the α state can be explained by competition between forward progress (requiring 2 ATP) and slow reversion to Ω.
Figure 7
Figure 7
Branched kinetic model for structural transitions and ATP coupling in DNA gyrase. (See also Supplementary Figure 3.) (a) Diagram of allowed transitions in the model. Several ATP binding transitions are approximated as rapid equilibria with state-dependent affinities K1, K2, and K3. Rate constants are labeled for all other transitions. Some reverse rates are assumed to be negligible and are not shown. The dissociation rate koff(F) varies with the tension F in the DNA molecule; all other rates are tension-independent. Unlabeled arrows represent transitions of unknown kinetics but are fast relative to k2. In aggregate, they may occupy as much as 0.5 s of the cycle (Fig. 2b). (b) Overall supercoiling velocity (expressed in strand passages per second) as a function of [ATP], as measured experimentally and predicted from the kinetic model. Inset expands the low [ATP] region. (c) Processivity of the enzyme, defined as the probability of completing a forward step before dissociating, as a function of [ATP]. The transition processivity (inset) is defined as the probability of docking a T-segment before dissociating, and remains measurable at 0 ATP. Error bars indicate SEM.

References

    1. Wang JC. Cellular roles of DNA topoisomerases: A molecular perspective. Nature Reviews Molecular Cell Biology. 2002;3:430–440. - PubMed
    1. Peter BJ, et al. Genomic transcriptional response to loss of chromosomal supercoiling in Escherichia coli. Genome Biology. 2004;5 - PMC - PubMed
    1. Vijayan V, Zuzow R, O’Shea EK. Oscillations in supercoiling drive circadian gene expression in cyanobacteria. Proceedings of the National Academy of Sciences of the United States of America. 2009;106:22564–22568. - PMC - PubMed
    1. Thomsen ND, Berger JM. Structural frameworks for considering microbial protein- and nucleic acid-dependent motor ATPases. Molecular microbiology. 2008;69:1071–90. - PMC - PubMed
    1. Saraste M, Sibbald PR, Wittinghofer A. The P-loop--a common motif in ATP- and GTP-binding proteins. Trends in biochemical sciences. 1990;15:430–4. - PubMed

Publication types