. 2012 Jun;50(7):1682-97.
doi: 10.1016/j.neuropsychologia.2012.03.024. Epub 2012 Mar 30.

Age differences in default and reward networks during processing of personally relevant information

Affiliations

Age differences in default and reward networks during processing of personally relevant information

Cheryl L Grady et al. Neuropsychologia. 2012 Jun.

Abstract

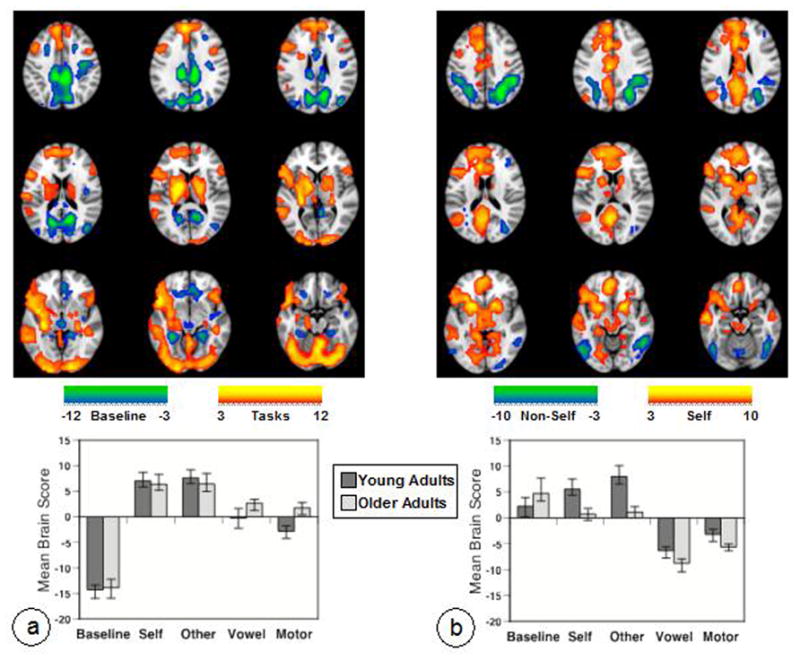
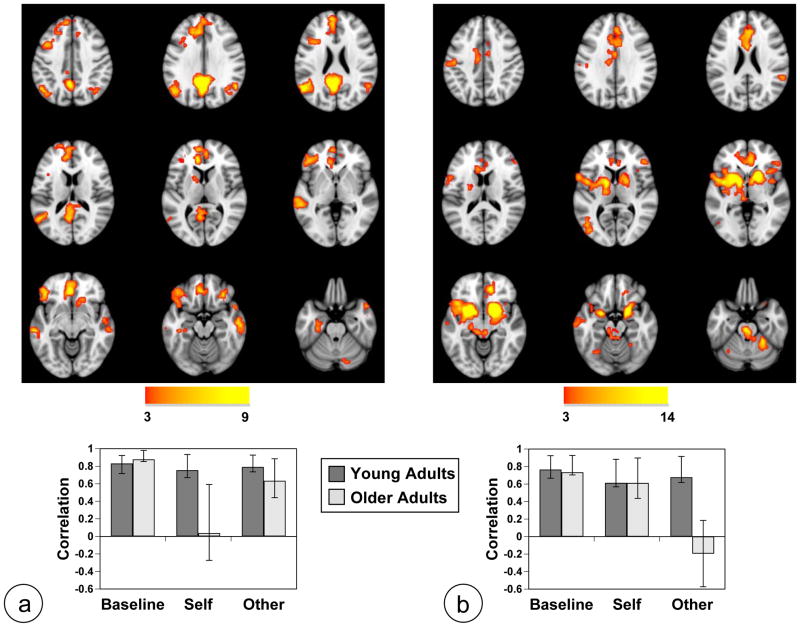
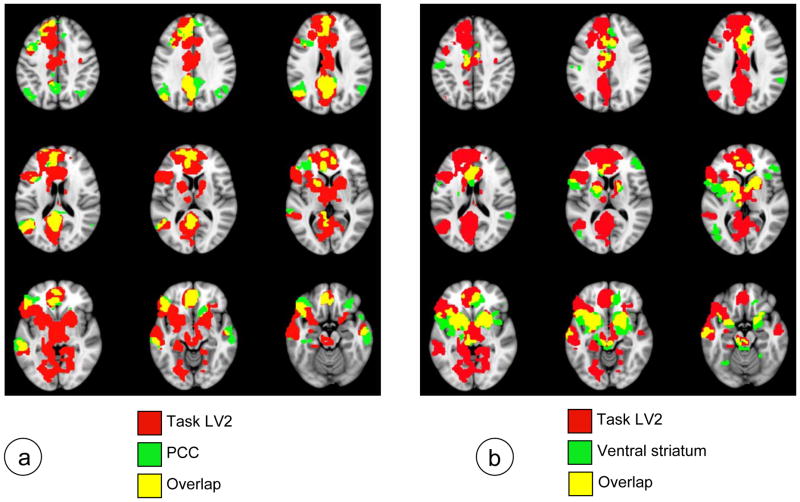
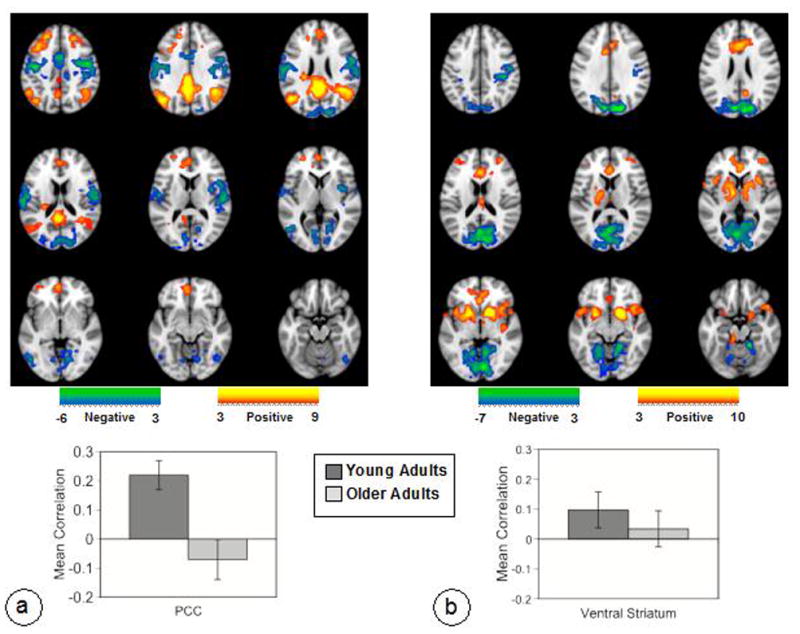
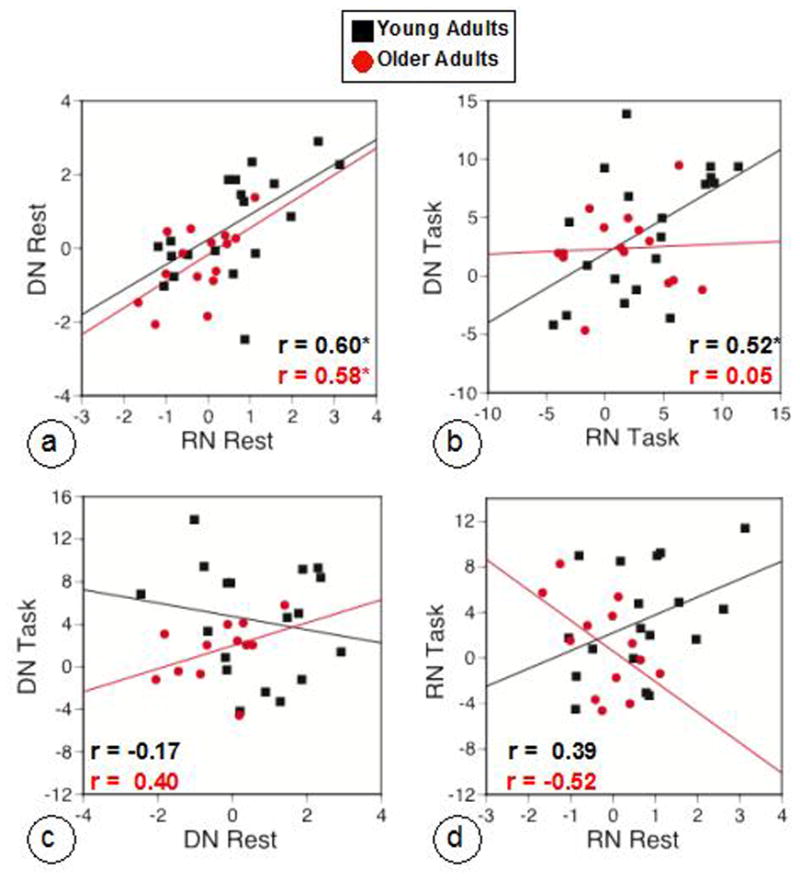
We recently found activity in default mode and reward-related regions during self-relevant tasks in young adults. Here we examine the effect of aging on engagement of the default network (DN) and reward network (RN) during these tasks. Previous studies have shown reduced engagement of the DN and reward areas in older adults, but the influence of age on these circuits during self-relevant tasks has not been examined. The tasks involved judging personality traits about one's self or a well known other person. There were no age differences in reaction time on the tasks but older adults had more positive Self and Other judgments, whereas younger adults had more negative judgments. Both groups had increased DN and RN activity during the self-relevant tasks, relative to non-self tasks, but this increase was reduced in older compared to young adults. Functional connectivity of both networks during the tasks was weaker in the older relative to younger adults. Intrinsic functional connectivity, measured at rest, also was weaker in the older adults in the DN, but not in the RN. These results suggest that, in younger adults, the processing of personally relevant information involves robust activation of and functional connectivity within these two networks, in line with current models that emphasize strong links between the self and reward. The finding that older adults had more positive judgments, but weaker engagement and less consistent functional connectivity in these networks, suggests potential brain mechanisms for the "positivity bias" with aging.


Figures

Figure 1
Figure 1
Results of the task-PLS analysis are shown on axial slices from the MNI152 average structural brain. Panel a shows LV1 and Panel b shows LV2. In the brain images (data have been resampled to 1 mm isotropic voxel size for display purposes here and in subsequent figures), greater activity in regions shown in warm colors is seen in conditions where the mean brain score (shown in the graphs below) is above zero (zero indicates overall mean activity as these scores have been mean-centered). Greater activity in cool-colored areas is seen in those conditions with mean brain scores below zero. The color bars indicate the minimum and maximum BSRs for each LV (threshold set to BSR=3). The graphs show the average of the mean-centered brain scores for each condition in each group (error bars are the 95% confidence intervals from the bootstrap procedure). Non-overlapping confidence intervals indicate differences between conditions or groups.
Figure 2
Figure 2
Functional connectivity of the DN (a) and RN (b) are shown on axial slices from the MNI152 average structural brain. Functional connectivity of the PCC and other DN regions (positive correlations, shown in warm colors) was robust across Baseline, Self and Other conditions in younger adults, and for Baseline and Other in the older group (correlation was not different from zero for Self in older adults). Functional connectivity of the right ventral striatum and the rest of the RN (positive correlations, shown in warm colors) was robust across all three conditions in younger adults, but was not reliably different from zero in the Other condition for older adults. The color bars indicate the minimum and maximum BSRs for each LV (threshold set to BSR=3). The graphs show the correlations between brain scores and seed activity for each condition. Error bars are the 95% confidence intervals from the bootstrap procedure.
Figure 3
Figure 3
Overlap maps for the two functional connectivity patterns (seen in figure 2) and the second task LV (seen in Figure 1b) are shown on axial slices from the MNI152 average structural brain. Red areas are those where there was more activity for the Self and Other tasks (relative to Vowel and Motor), green areas are those with positive functional connectivity with either the PCC (a) or the right ventral striatum (b), and yellow areas are those with overlap between the task and functional connectivity maps. A BSR threshold of 3.0 was used for all images in these maps.
Figure 4
Figure 4
Secondary functional connectivity patterns of the DN (a) and RN (b) during the resting-state scan are shown on axial slices from the MNI152 average structural brain. Functional connectivity of both networks was temporally variable, with some time periods showing connectivity within the DN and RN (warm colors) and others showing connectivity within the cool colored regions. The graphs show the mean correlation (across the 30 resting “blocks”) between brain scores and seed activity for each group. Error bars are the standard error of the mean. See Supplementary Figure 4 for the full time courses of correlation values.
Figure 5
Figure 5
Scatter plots for the correlations among the network activity patterns for the DN and RN. a: the correlation between brain scores from the resting seed PLS of the PCC (DN, LV2) and ventral striatum (RN, LV2), with more positive brain scores indicating more activity in the DN and RN regions seen in Figure 4; b: the correlation between brain scores from the task-run seed PLS of the PCC (Self condition) and ventral striatum (Other condition), with more positive brain scores indicating more activity in the DN and RN regions seen in Figure 2; c: the correlation between brain scores from the task-run seed PLS of the PCC (Self condition) and resting seed PLS for the PCC; d: the correlation between brain scores from the task-run seed PLS of the ventral striatum (Other condition) and resting seed PLS for the striatum. Correlation coefficient values are shown for young (black) and older (red) adults; ‘*’ denotes p < 0.05. Note that the sample sizes for older adults in the rest-task correlations are smaller than for the within-rest or within-task comparisons due to some older participants not having usable task data or rest data.

References

    1. Abler B, Walter H, Erk S, Kammerer H, Spitzer M. Prediction error as a linear function of reward probability is coded in human nucleus accumbens. NeuroImage. 2006;31:790–795. - PubMed
    1. Addis DR, McIntosh AR, Moscovitch M, Crawley AP, McAndrews MP. Characterizing spatial and temporal features of autobiographical memory retrieval networks: a partial least squares approach. Neuroimage. 2004;23:1460–1471. - PubMed
    1. Ames DL, Jenkins AC, Banaji MR, Mitchell JP. Taking another person’s perspective increases self-referential neural processing. Psychological Science. 2008;19:642–644. - PubMed
    1. Anderson N. Likeableness ratings of 555 personality trait adjectives. Journal of Personality and Social Psychology. 1968;9:272–279. - PubMed
    1. Andrews-Hanna JR, Reidler JS, Sepulcre J, Poulin R, Buckner RL. Functional- anatomic fractionation of the brain’s default network. Neuron. 2010;65:550–562. - PMC - PubMed

Publication types

MeSH terms