. 2012 May;15(5):776-85.
doi: 10.1038/nn.3088.

Localized microstimulation of primate pregenual cingulate cortex induces negative decision-making

Affiliations

Localized microstimulation of primate pregenual cingulate cortex induces negative decision-making

Ken-ichi Amemori et al. Nat Neurosci. 2012 May.

Abstract

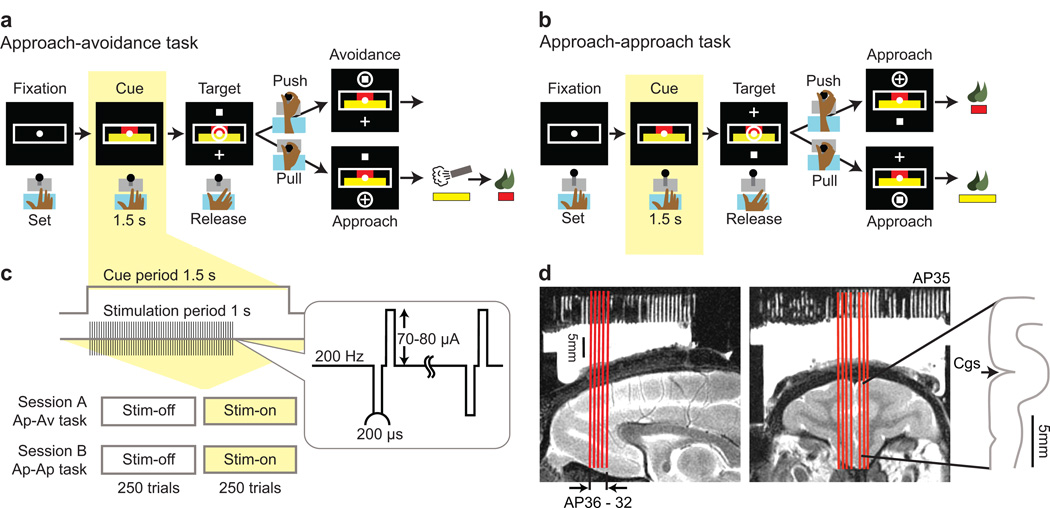
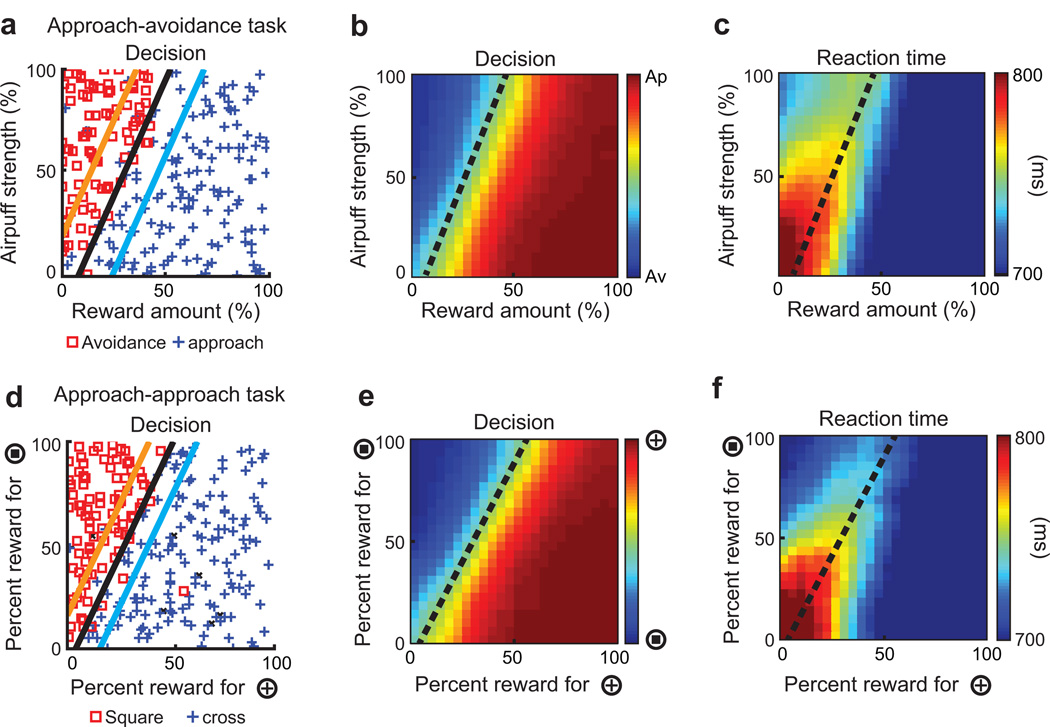
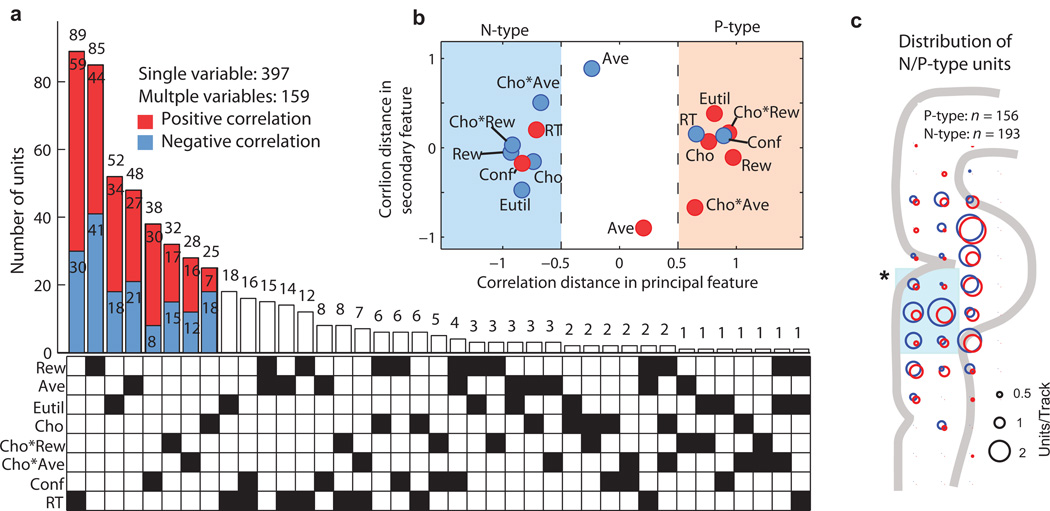
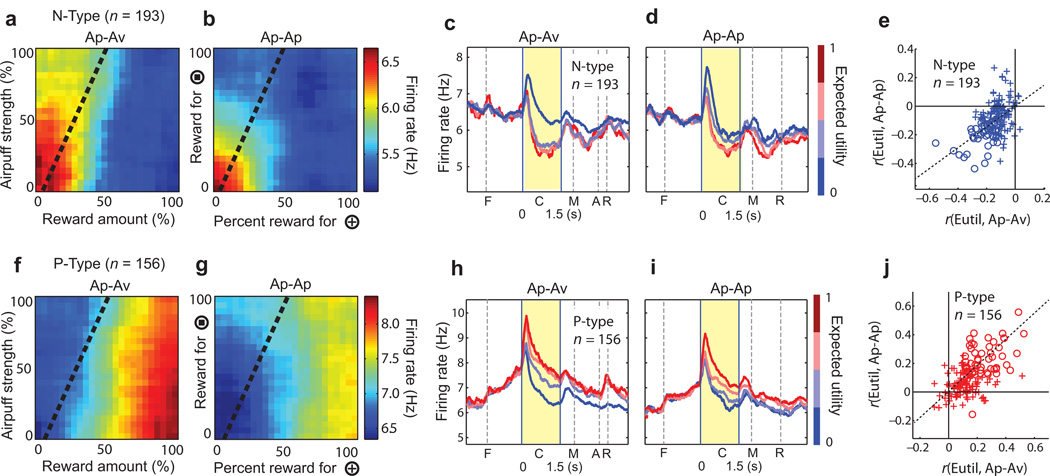
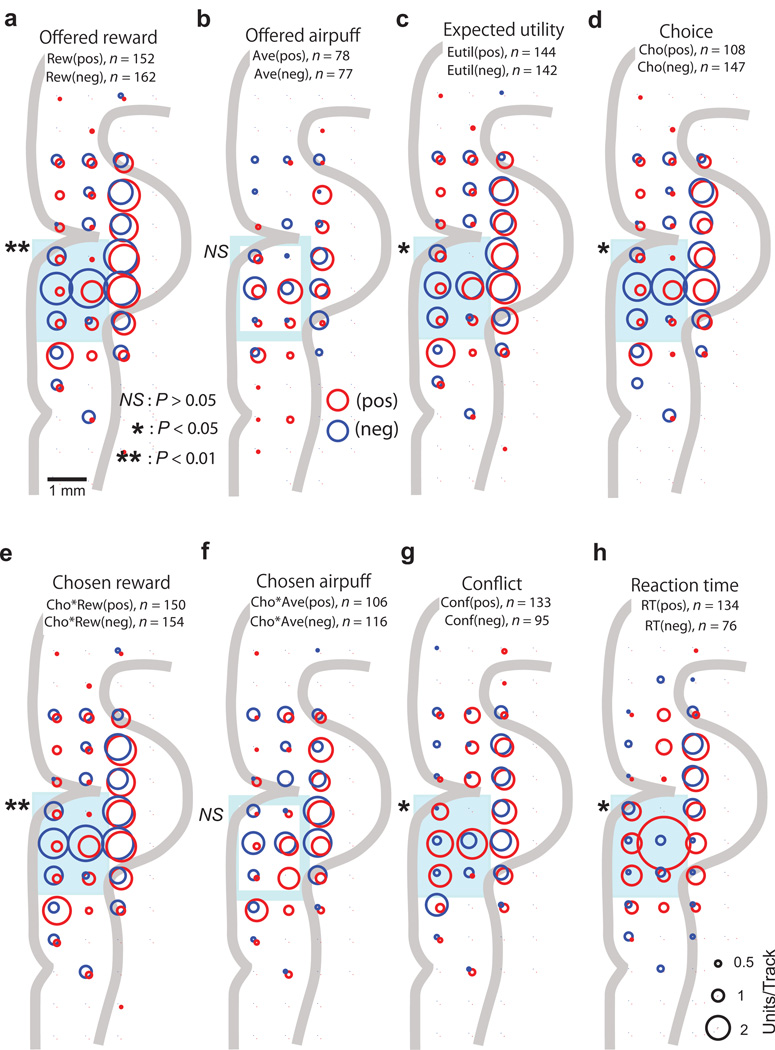
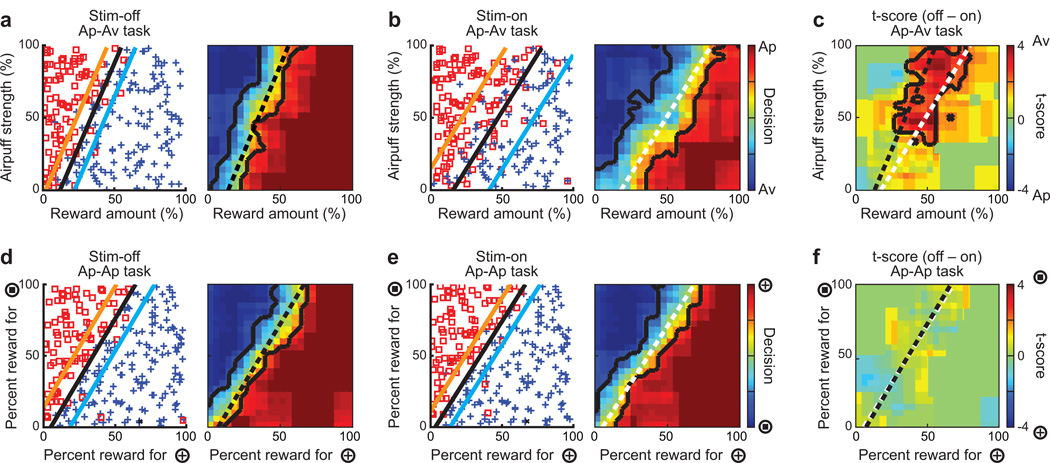
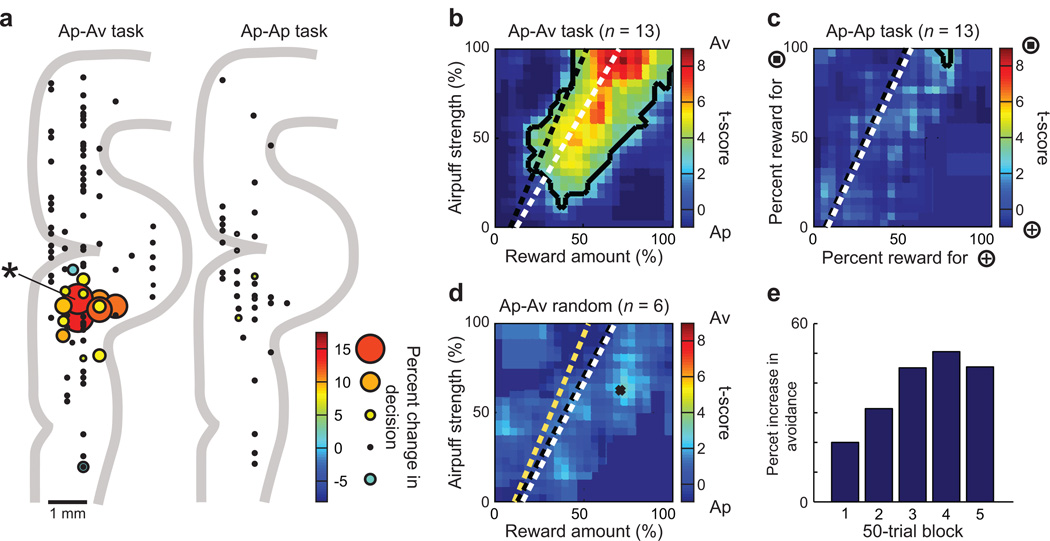
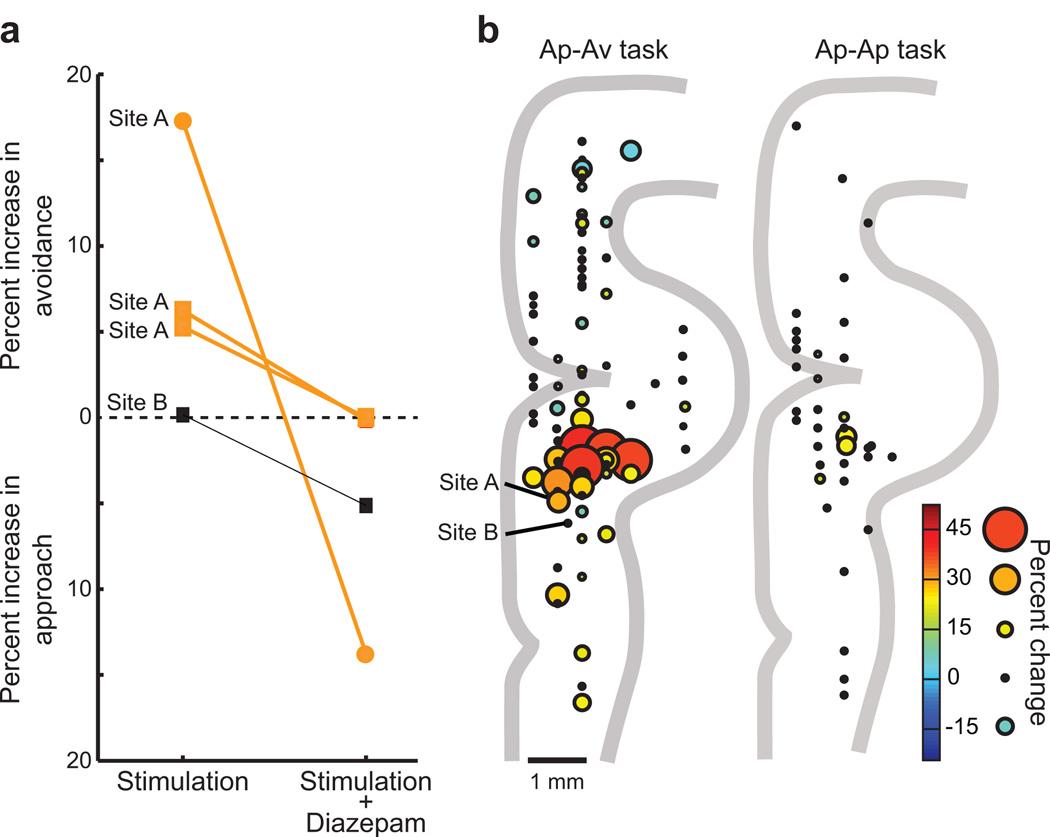
The pregenual anterior cingulate cortex (pACC) has been implicated in human anxiety disorders and depression, but the circuit-level mechanisms underlying these disorders are unclear. In healthy individuals, the pACC is involved in cost-benefit evaluation. We developed a macaque version of an approach-avoidance decision task used to evaluate anxiety and depression in humans and, with multi-electrode recording and cortical microstimulation, we probed pACC function as monkeys performed this task. We found that the macaque pACC has an opponent process-like organization of neurons representing motivationally positive and negative subjective value. Spatial distribution of these two neuronal populations overlapped in the pACC, except in one subzone, where neurons with negative coding were more numerous. Notably, microstimulation in this subzone, but not elsewhere in the pACC, increased negative decision-making, and this negative biasing was blocked by anti-anxiety drug treatment. This cortical zone could be critical for regulating negative emotional valence and anxiety in decision-making.


Figures

Figure 1
Figure 1
Task procedures and recording regions. (a) Task flow diagram of the approach-avoidance (Ap-Av) task. The task started when the monkey put the hand on the home position. After 1.5-s fixation period, two bars appeared on the screen as a visual cue. The lengths of red and yellow bars indicated, respectively, the amount of liquified food and airpuff delivered after approach choice. After the 1.5-s cue period, the monkey could move the joystick to choose one target. Cross target indicated approach, and square target indicated avoidance. The locations of two targets were randomized across trials. After approach decisions, both airpuff and food were delivered in the indicated amounts. After avoidance decision, the monkey did not receive the indicated airpuff and food. (b) Task flow diagram of the approach-approach (Ap-Ap) task. The lengths of red and yellow bars corresponded to the amount of reward that the monkey could obtain after choosing cross and square targets, respectively. (c) Stimulation procedure. Daily sessions consisted of stimulation-off and stimulation-on blocks, each with 250 trials. In stimulation-on trials, microstimulation (a train of biphasic pluses; frequency: 200 Hz, current amplitude: 70–80µA) was applied for 1 s, starting at the onset of the visual cue. (d) Sagittal (left) and coronal (right) magnetic resonance images of the pregenual recording region. Red lines indicate estimated tracks of recording and stimulation electrodes ranging from AP 32 to AP 36. To the right, a schematic diagram of the pACC is shown with cingulate sulcus (Cgs).
Figure 2
Figure 2
Behavioral patterns. (a) Avoidance (red square) and approach (blue cross) choice made by monkey S in a single session of the Ap-Av task. Black line indicates the decision boundary calculated by logistic regression. Light blue and orange lines indicate 90% and 10% probability, respectively, of choosing approach estimated by the regression model. (b, c) Decision (b; red: approach, blue: avoidance) and reaction times (c; red: slow, blue: fast) averaged over all experiments for the Ap-Av task and plotted according to pseudocolor scales at right. Dotted lines indicate decision boundaries calculated based on all the accumulated data. (d) Choice of square (red square) and cross (blue cross) targets in a single session of the Ap-Ap task, by monkey S. Black, light blue and orange lines represent 50%, 90%, and 10% probabilities of choosing cross target, calculated by logistic regression. (e, f) Target choice (e) and reaction times (f) averaged over all Ap-Ap experiments. Dotted lines indicate decision boundary.
Figure 3
Figure 3
Classification of units recorded in the pACC region. (a) Results of stepwise regression analysis for the Ap-Av task. Regression variables are offered reward (Rew), offered airpuff (Ave), choice (Cho), chosen reward (Cho*Rew), chosen airpuff (Cho*Ave), reaction times (RT), expected utility (Eutil) and conflict in decision (Conf). Y-axis indicates the number of recorded units best characterized by one or a combination of the variables identified in the matrix below. Black squares in the matrix along X-axis indicate the variable or variables selected by the stepwise regression procedure. Many units (397 units) were characterized by the single variables that we chose. These units were further classified by whether the activity was positively (red) or negatively (blue) correlated with the variable. Another 159 units were characterized by particular combinations of variables indicated by black squares in the matrix. (b) Results of multidimensional scaling performed based on the correlation distance of the firing patterns of each type of unit. X-axis shows the principal feature dimension, and y-axis shows the second feature dimension extracted by this procedure. Types of units located closely to each other indicate that their firing patterns are similar. Blue circles indicate the locations of units with activity negatively correlated with the indicated variable. Red circle indicate the locations of units with activity positively correlated with the indicated variable. Units were classified by the similarity derived in the primary feature, N-type (light blue region) and P-type (light red region). (c) Cortical distribution of N-type (blue circle) and P-type (red circle) units. In the ventral bank of the cingulate sulcus (blue shading), N-type units significantly outnumbered P-type units (Fisher's exact test, P < 0.05).
Figure 4
Figure 4
Response properties of N-type (a–e) and P-type (f–j) units. (a, b, f, g) Population cue-period activity (color scale to right) of N-type (a and b) and P-type (f and g) units relative to the visual cue in the Ap-Av (a and f) and Ap-Ap (b and g) tasks. Black dotted line indicates the decision boundary. (c, d, h, i) Population activity across task-time for N-type (c and d) and P-type (h and i) units in the Ap-Av (c and h) and Ap-Ap (d and i) tasks. Line colors correspond to expected utility as indicated by color bar at right. Before averaging across sessions, the expected utility was normalized in each session so that the maximum expected utility is set to 1 and minimum expected utility to 0. F: fixation, C: cue, M: movement, A: airpuff, R: reward. Yellow shading indicates the cue period. (e, j) Scatterplots of correlation coefficients between cue-period activity and expected utility calculated for N-type (e) and P-type (j) units. Dotted line indicates regression slope. X-axis represents correlation coefficients between cue-period activity in the Ap-Av task and the expected utility calculated for the Ap-Av task. Y-axis represents correlation coefficients between cue-period activity in the Ap-Ap task and the expected utility calculated for the Ap-Ap task. Each circle indicates an N-type (e) or P-type (j) unit for which cue-period activity was significantly correlated with the expected utility calculated for both Ap-Av and Ap-Ap tasks (Pearson's correlation coefficients, P < 0.05). Cross indicates another unit that did not show a correlation between activity and utility in both tasks.
Figure 5
Figure 5
Distributions of pACC units classified by the correlation analyses. Distributions and numbers (indicated by size of circles) of units whose activity showed significantly positive (red, pos-type) or negative (blue, neg-type) correlations (Pearson's correlation coefficients, P < 0.05) with offered amount of reward (Rew, a), offered strength of airpuff (Ave, b), expected utility (Eutil, c), approach or avoidance decision (Cho, d), amount of chosen reward (Cho*Rew, e), strength of chosen airpuff (Cho*Ave, f), conflict in decision (Conf, g), and reaction time (RT, h). Total numbers of correlated units are indicated (n). For each distribution, we tested whether the neg-type or the pos-type populations of units in the ventral bank cortex significantly outnumbered the counterpart (blue shading, Fisher's exact test, P < 0.05) or not (blue rectangle).
Figure 6
Figure 6
Effects of pACC microstimulation on decision-making. Microstimulation (70 µA) was delivered during cue period at a single site (indicated by asterisk in Fig. 7a) in monkey S as she performed single Ap-Av (a–c) and Ap-Ap (d–f) task-sessions on consecutive days. (a, b, d, e) Left panels show scatter plots of each decision for stimulation-off (a and d) and stimulation-on (b and e) trials. Blue cross and red square indicate choice of cross and square targets, respectively. Black line indicates the session’s decision boundary estimated by logistic regression analysis. Light blue and orange lines indicate the 90% and 10% levels, respectively, for choices of cross target, estimated by the modeled data produced by the logistic regression. Right panels show the mean choices for these stimulation-off (a and d) and stimulation-on (b and e) trials, with decision boundaries shown as dotted lines (black: stimulation-off, white: stimulation-on). Data were smoothed by a square window (20% by 20% of the decision matrix). Black outlines enclose decisions with 5% to 95% probability of cross target choices. (c, f) Matrix plots of t-scores demonstrating significant stimulation-induced increase in avoidance in the Ap-Av task (c), and lack of significant stimulation effect in the Ap-Ap task (f). Region outlined in black in c indicates zone with significant effects (Fisher’s exact test, P < 0.05), which covered 16.6% of the entire data matrix.
Figure 7
Figure 7
Distribution and dynamics of stimulations affecting decision-making. (a) Distribution of all stimulation sites in Ap-Av (left) and Ap-Ap (right) tasks (current amplitude: 70–80 µA). Sizes and colors of circles indicate percentage of stimulation-induced change in decision (red-orange hues, increased avoidance; blue hues, increased approach). Circle centers show locations of monopolar electrodes or mid-points between bipolar electrodes. Black dots represent sites with less than 3% stimulation-induced change. Data collected from both hemispheres of monkeys S and A. (b) Average changes in decision shown for all ventral bank effective sites (n = 13), expressed as t-scores. Black outline surrounds significant data (Fisher’s exact test, P < 0.01). Dotted lines indicate decision boundary (black: stimulation-off, white: stimulation-on). (c) Lack of stimulation-induced change in Ap-Ap task. (d) Lack of stimulation-induced difference in experiments with randomly presented stimulation-on trials (white dotted line) and stimulation-off trials (black dotted line). Yellow dotted line indicates decision boundary of collected data obtained in the stimulation-off trials in previous sessions. (e) Dynamics of stimulation effects on decisions for the 13 effective sites. Accumulated stimulation-on data were segregated into 5 temporal stages. Each bar represents the size of increase in avoidance in each of consecutive 50-trial stimulation-on blocks, relative to the 250-trial stimulation-off block.
Figure 8
Figure 8
Evidence suggesting potential negative affective state changes induced by microstimulation. (a) Effects of the anxiolytic, diazepam (0.25 mg/kg, IM), on the stimulation-induced change in the approach-avoidance decisions. Orange lines indicate the results of stimulation at site previously identified as an effective site A (square terminals: 80 µA, 2 sessions; circle terminals: 150 µA, 1 session) before and after diazepam treatment. Black line shows the result of diazepam treatment at ineffective site B, where stimulation (80 µA) did not induce a change in decision. Locations of sites A and B are shown in b. (b) Percent changes in the cost-benefit ratio defined by the ratio of sensitivities to offered airpuff and offered reward. The two sensitivities were derived from coefficients of the logistic behavioral model. Left panel: Ap-Av task (red-orange hues, increased sensitivity to aversive airpuff relative to reward; blue hues, increased sensitivity to reward relative to airpuff; black, no effect). Right panel: Ap-Ap task (yellow, increase in placing more value in square target; black, no effect).

Comment in

  • Is the reward really worth it?
    Kennerley SW. Kennerley SW. Nat Neurosci. 2012 Apr 25;15(5):647-9. doi: 10.1038/nn.3096. Nat Neurosci. 2012. PMID: 22534574 No abstract available.

References

    1. Lewin KZ. A dynamic theory of personality. New York: McGraw-Hill; 1935.
    1. Miller NE. Selected papers on conflict, displacement, learned drives and theory. Chicago, Illinois: Aldine Atherton; 1971.
    1. Elliot AJ. Handbook of approach and avoidance motivation. New York: Psychology Press; 2008.
    1. Elliot AJ, Thrash TM. Approach-avoidance motivation in personality: approach and avoidance temperaments and goals. J Pers Soc Psychol. 2002;82:804–818. - PubMed
    1. Millan MJ. The neurobiology and control of anxious states. Prog in Neurobiol. 2003;70:83–244. - PubMed

Publication types

MeSH terms