Predicting developmental status from 12 to 24 months in infants at risk for Autism Spectrum Disorder: a preliminary report
- PMID: 22484794
- PMCID: PMC3565427
- DOI: 10.1007/s10803-012-1521-0
Predicting developmental status from 12 to 24 months in infants at risk for Autism Spectrum Disorder: a preliminary report
Abstract
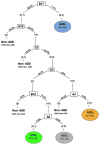
The study examined whether performance profiles on individual items of the Toddler Module of the Autism Diagnostic Observation Schedule at 12 months are associated with developmental status at 24 months in infants at high and low risk for developing Autism Spectrum Disorder (ASD). A nonparametric decision-tree learning algorithm identified sets of 12-month predictors of developmental status at 24 months. Results suggest that identification of infants who are likely to exhibit symptoms of ASD at 24 months is complicated by variable patterns of symptom emergence. Fine-grained analyses linking specific profiles of strengths and deficits with specific patterns of symptom emergence will be necessary for further refinement of screening and diagnostic instruments for ASD in infancy.
Figures


References
-
- American Psychiatric Association. Diagnostic and statistical manual of mental disorders. 4. Washington, DC: Author; 2000. text revision.
-
- Bailey A, Phillips W, Rutter M. Autism: Towards an integration of clinical, genetic, neuropsychological, and neurobiological perspectives. Journal of Child Psychology and Psychiatry. 1996;37(1):89–126. - PubMed
-
- Bates E, Benigni L, Bretherton L, Camaioni L, Volterra V. The emergence of symbols: Cognition and communication in infancy. New York: Academic Press; 1979.
-
- Breiman L, Friedman J, Olshen R, Stone C. Classification and regression trees. New York, NY: Wadsworth; 1984.
-
- Bryson SE, Zwaigenbaum L, Brian J, Roberts W, Szatmari P, Rombough V, et al. A prospective case series of high-risk infants who developed autism. Journal of Autism and Developmental Disorders. 2007;37(1):12–24. - PubMed
Publication types
MeSH terms
Grants and funding
LinkOut - more resources
Full Text Sources
Medical

