. 2012 Mar 19:6:11.
doi: 10.3389/fnint.2012.00011. eCollection 2012.

Species-Specific Flight Styles of Flies are Reflected in the Response Dynamics of a Homolog Motion-Sensitive Neuron

Affiliations

Species-Specific Flight Styles of Flies are Reflected in the Response Dynamics of a Homolog Motion-Sensitive Neuron

Bart R H Geurten et al. Front Integr Neurosci. .

Abstract

Hoverflies and blowflies have distinctly different flight styles. Yet, both species have been shown to structure their flight behavior in a way that facilitates extraction of 3D information from the image flow on the retina (optic flow). Neuronal candidates to analyze the optic flow are the tangential cells in the third optical ganglion - the lobula complex. These neurons are directionally selective and integrate the optic flow over large parts of the visual field. Homolog tangential cells in hoverflies and blowflies have a similar morphology. Because blowflies and hoverflies have similar neuronal layout but distinctly different flight behaviors, they are an ideal substrate to pinpoint potential neuronal adaptations to the different flight styles. In this article we describe the relationship between locomotion behavior and motion vision on three different levels: (1) We compare the different flight styles based on the categorization of flight behavior into prototypical movements. (2) We measure the species-specific dynamics of the optic flow under naturalistic flight conditions. We found the translational optic flow of both species to be very different. (3) We describe possible adaptations of a homolog motion-sensitive neuron. We stimulate this cell in blowflies (Calliphora) and hoverflies (Eristalis) with naturalistic optic flow generated by both species during free flight. The characterized hoverfly tangential cell responds faster to transient changes in the optic flow than its blowfly homolog. It is discussed whether and how the different dynamical response properties aid optic flow analysis.

Keywords: calliphora vicina; eristalis tenax; lobula tangential cells; motion vision; optic flow; prototypical movements; ventral centrifugal horizontal cell.


Figures

Figure 1
Figure 1
Prototypical movements. Prototypical movements (PMs) of blowflies and hoverflies in confined arenas. Each translational velocity (forward, upward, sideways) is normalized to the absolute maximum of all translational velocities. The rotational velocities (yaw, pitch, roll) were normalized accordingly. The velocities are plotted as length of the arrows around a position. The gray arrows show the normalized maximum velocity. The colored arrows show the velocity combination for that PM (for color code see inset). The PMs are numbered. Below the PM number are its percentage in the data and its mean duration ± SD. (A) Eristalis PMs derived from body trajectories omitting roll velocities, which we could not track for a larger dataset (see Materials and Methods). (B) Calliphora PMs derived from head trajectories (Braun et al., 2010).
Figure 2
Figure 2
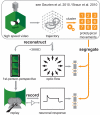
Experimental overview. Overview of the experimental procedures used to obtain the data presented in this article. We recorded Eristalis tenax with a set of high-speed cameras (upper left corner) to obtain 3D trajectories of their flights (first row, middle). In case of Calliphora vicina Dr. van Hateren (University of Groningen, Netherlands) provided us with 3D head trajectories. We used these trajectories as data for clustering analysis that rendered nine prototypical movements (PMs; upper right corner). The first row is enclosed by a frame, which indicates that these results were already published. We used these PMs as categories and each position in the trajectories is assigned to a PM. Bearing this in mind, we reconstructed the optic flow seen while moving on a given trajectory (central picture). Now we could use the nine PMs to segregate the optic flow we calculated directly from head trajectories (second row, right). Hence we were able to calculate the optic flow from all the positions that were assigned to the same PM. Furthermore we reconstructed first person perspective movies (second row, left) from the same trajectories. We used these movies as stimuli for electrophysiological experiments (third row left). The neuronal responses from these experiments (third row, middle) could be again segregated with the PMs (third row, right).
Figure 3
Figure 3
Mean optic flow induced by prototypical movements. Optic flow calculated geometrical from head trajectories of both species. The red arrows are scaled differently than the blue ones (they code for four times the velocity of the blue arrows). A field of view of 120° elevation is depicted. The mean optic flow for each prototypical movement was calculated (numeration as in Figure 1). In the lower left corner of each flow field the corresponding PM is shown. (A) Eristalis optic flow calculated with head trajectories and segregated after body PMs. (B) Calliphora optic flow calculated from head trajectories and segregated after head PMs.
Figure 4
Figure 4
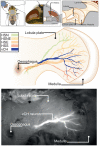
Morphology of the Eristalis ventral centrifugal horizontal (vCH) neuron in relation to the four HS-cells. The top row insets show the location of the lobula plate inside the hoverfly’s head. The ventral–dorsal projection of the lobula plate with superimposed tangential cells is drawn below. The reconstructions of depth projections (z-projections) of the cells’ main arborizations were copied by hand into vector graphics. The horizontal system (green, yellow, orange, red) was plotted to give relative position of the vCH (blue). In the bottom row a z-projection of the vCH cell is superimposed on a wide-field image of the fly’s brain.
Figure 5
Figure 5
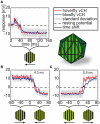
vCH responses to instantaneous velocity changes during spinning drum stimulation. The vCH cells of blowflies and hoverflies were stimulated with a sinusoidal vertical stripe pattern moving in horizontal direction at 2 Hz temporal frequency for 1080 ms in each direction. Onset to null-direction motion (A) and to direction changes of either polarity (B,C). Resting potential is marked by the dashed black line. The blue line denotes the Calliphora responses (N = 5, n = 3–7) and the red line the Eristalis responses (N = 8, n = 2–10). The gray areas around the lines mark the standard deviations. Light green horizontal lines correspond to time shifts (green numbers) between responses at half-maximal response. The stimulus apparatus is depicted next to the figure legend. Below the time axis the movement direction of the stripe pattern is given.
Figure 6
Figure 6
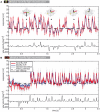
vCH responses to flight reconstructions. (A) Mean response (±SD) of Eristalis (red) and Calliphora (blue) vCH cells, respectively, to the reconstruction of the optic flow experienced during an Eristalis flight. Dashed black line marks the resting potential. vCH responds best to horizontal motion. Therefore, the corresponding yaw velocity trace is plotted below the responses in black. In A strong depolarizations not accompanying fast yaw velocities were marked with an asterisk. The prototype assigned to the trajectory at each such instance is plotted above. (B) The responses of the same neurons to a Calliphora flight. Eristalis vCH N = 8, n = 3–11 | Calliphora vCH N = 5, n = 3–23.
Figure 7
Figure 7
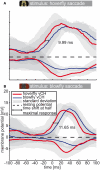
Saccade-triggered vCH response. Mean response (±SD) of Eristalis and Calliphora vCH cells, respectively, in a 200-ms time window centered about the peak velocity of yaw saccades (0 ms). Eristalis response (N = 8, n = 3–11) is plotted in red and the Calliphora response (N = 5, n = 3–23) is plotted in blue. Light green numbers and line denote the time shift between mean responses at half-maximal response. Resting potential is marked by the dashed black line. (A) Eristalis, (B) Calliphora saccades.
Figure 8
Figure 8
Responses to sideways direction inversion during forward flight. This figure shows the vCH responses to translational direction changes. The color code is as in Figure 5 (Eristalis vCH n = 8 | Calliphora vCH n = 5). Plots show mean responses (±SD) of Eristalis and Calliphora vCH cells, respectively, in a 44-ms time window centered about the movement direction switch from forward-right to forward-left (A,B) or vice versa (C,D) (see insets). At 0 ms the direction switches. Responses in (A,C) were elicited by Eristalis flights. The stimuli in (B,D) were from Calliphora. The time shift denotes the time difference between reaching the half-maximal response in Eristalis and Calliphora vCH, respectively. Resting potential is marked by the dashed black line. Note the differently scaled y-axis in (D).
Figure 9
Figure 9
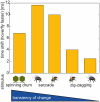
Time shift overview. Time shift between the responses of Calliphora and Eristalis. In all cases Eristalis vCH reacted faster to the change in optic flow as determined by the time difference between reaching the half-maximal response. Below each bar the stimulus is depicted that corresponds to the time shift. Stimuli always built from changes to preferred direction motion. Time shifts corresponding to the following stimuli (from left to right): (1) Instantaneous direction inversion in a spinning drum experiment; (2) Calliphora saccade; (3) Eristalis saccade; (4) Switch from a forward-right to a forward-left movement in Eristalis; (5) Switch from a forward-right to a forward-left movement in Calliphora; Note that the sideways component preceding the switch is much smaller in Calliphora than in Eristalis, therefore the change in optic flow is larger in (4) than in (5).
Figure A1
Figure A1
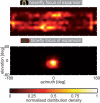
Distribution of the focus of expansion. The location of the focus of expansion within the visual field was calculated from the optic flow corresponding to the head trajectories and plotted as color coded density distribution; top: hoverfly, bottom: blowfly. The data were interpolated to avoid hard edges of the sample point grid (grid as in Figure 3). The density was normalized to the highest count inside the sample point grid separately for each plot.
Figure A2
Figure A2
Receptive field of vCH in Eristalis and Calliphora. Each plot shows the receptive field of vCH in a window of >140° elevation and >160° azimuth. The false color map behind the local preferred directions codes for the mean response amplitude of the cells to movement from the left to the right at seven different elevations. The false color map was interpolated to avoid hard edges of binning the data. The superimposed arrows show the local preferred directions (length codes for local sensitivity). Black arrows are samples. Gray arrows are linearly interpolated. To determine the receptive fields a narrow but high (2° × 10°) target was presented to vCH neurons which traversed the complete field of view horizontally at seven different elevations in both directions. In addition, the same target, rotated by 90°, was presented on a vertical trajectory at seven different azimuths. The local direction preference of the vCH cell (Figure A2) was calculated as follows: At first we corrected for the latencies of the cells. We calculated the latency from the replay experiments (see Materials and Methods), by calculating the mean time difference between the saccade velocity peak and the response amplitude peak. For each movement direction adopted by our bar stimulus (left to right, right to left, top to bottom, bottom to top) we calculated the mean response across cells. We treated the membrane potential change as the length of a vector pointing in the direction of target motion. Summation of all four vectors yielded the preferred direction vector. The length of this vector was set to represent the local direction sensitivity. This was done at all locations within the sampling grid. The color map behind the local preferences shows the mean interpolated reaction of the cells to left-to-right motion. (A) Receptive field of Eristalis vCH (n = 3), (B) receptive field of Calliphora vCH (n = 4).

Similar articles

Cited by

References

    1. Barnett P. D., Nordström K., O’Carroll D. C. (2010). Motion adaptation and the velocity coding of natural scenes. Curr. Biol. 20, 994–99910.1016/j.cub.2010.03.072 - DOI - PubMed
    1. Boeddeker N., Dittmar L., Stürzl W., Egelhaaf M. (2010). The fine structure of honeybee head and body yaw movements in a homing task. Proc. Biol. Sci. 277, 1899–190610.1098/rspb.2009.1928 - DOI - PMC - PubMed
    1. Boeddeker N., Lindemann J. P., Egelhaaf M., Zeil J. (2005). Responses of blowfly motion-sensitive neurons to reconstructed optic flow along outdoor flight paths. J. Comp. Physiol. A 191, 1143–115510.1007/s00359-005-0038-9 - DOI - PubMed
    1. Borst A., Haag J., Reiff D. F. (2011). Fly motion vision. Annu. Rev. Neurosci. 33, 49–7010.1146/annurev-neuro-060909-153155 - DOI - PubMed
    1. Braun E., Geurten B., Egelhaaf M. (2010). Identifying prototypical components in behaviour using clustering algorithms. PLoS ONE 5, e9361.10.1371/journal.pone.0009361 - DOI - PMC - PubMed

LinkOut - more resources