. 2012;7(4):e33308.
doi: 10.1371/journal.pone.0033308. Epub 2012 Apr 2.

Measuring adiposity in patients: the utility of body mass index (BMI), percent body fat, and leptin

Affiliations

Measuring adiposity in patients: the utility of body mass index (BMI), percent body fat, and leptin

Nirav R Shah et al. PLoS One. 2012.

Abstract

Background: Obesity is a serious disease that is associated with an increased risk of diabetes, hypertension, heart disease, stroke, and cancer, among other diseases. The United States Centers for Disease Control and Prevention (CDC) estimates a 20% obesity rate in the 50 states, with 12 states having rates of over 30%. Currently, the body mass index (BMI) is most commonly used to determine adiposity. However, BMI presents as an inaccurate obesity classification method that underestimates the epidemic and contributes to failed treatment. In this study, we examine the effectiveness of precise biomarkers and duel-energy x-ray absorptiometry (DXA) to help diagnose and treat obesity.

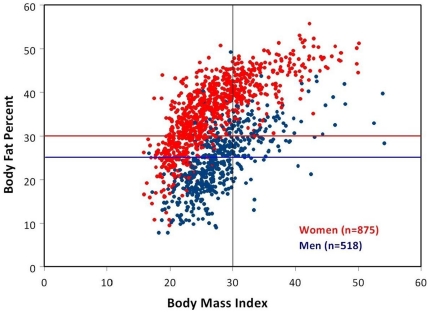
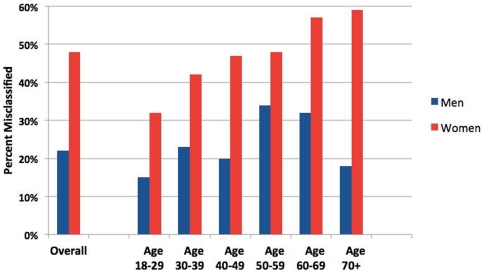
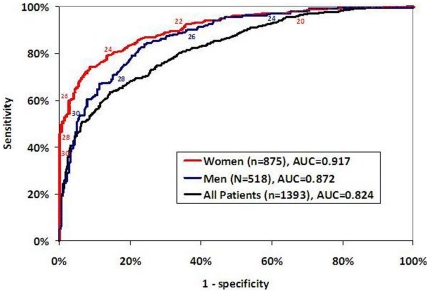
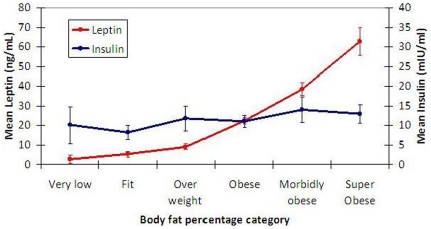
Methodology/principal findings: A cross-sectional study of adults with BMI, DXA, fasting leptin and insulin results were measured from 1998-2009. Of the participants, 63% were females, 37% were males, 75% white, with a mean age = 51.4 (SD = 14.2). Mean BMI was 27.3 (SD = 5.9) and mean percent body fat was 31.3% (SD = 9.3). BMI characterized 26% of the subjects as obese, while DXA indicated that 64% of them were obese. 39% of the subjects were classified as non-obese by BMI, but were found to be obese by DXA. BMI misclassified 25% men and 48% women. Meanwhile, a strong relationship was demonstrated between increased leptin and increased body fat.

Conclusions/significance: Our results demonstrate the prevalence of false-negative BMIs, increased misclassifications in women of advancing age, and the reliability of gender-specific revised BMI cutoffs. BMI underestimates obesity prevalence, especially in women with high leptin levels (>30 ng/mL). Clinicians can use leptin-revised levels to enhance the accuracy of BMI estimates of percentage body fat when DXA is unavailable.


Conflict of interest statement

Competing Interests: The authors have read the journal's policy and have the following conflicts: This work was supported by a research grant from the PATH Foundation. All research and financial support for this article preceded NRS's joining the New York State Department of Health. Similarly, except for minor editorial changes, the article was completed before that time. The views expressed in this article are solely those of the authors as individuals and do not represent the views or policies of the State of New York or the New York State Department of Health. During the period when the work was completed, NRS was also supported by grant 1 R01 HS01 8589-01. All authors have completed the Unified Competing Interest form at www.icmje.org/coi_disclosure.pdf (available on request from the corresponding author and declare that (1) NRS has received grants from the PATH Foundation for the submitted work; ERB has received no personal compensation for the submitted work; (2) NRS has relationships with AstraZeneca, Pfizer, Merck, Ortho-McNeil, Roche, Shering-Plough, GlaxoSmithKline, Novartis, Partners Healthcare, Bellevue Hospital Association, NIH, AHRQ, CDC, Robert Wood Johnson Foundation, Cerner LifeSciences, Vemco MedEd, FAIR Health, Venebio Group, LLC, American Academy of Neurology, Pinnacle Health Geisinger Health System, MetaResearch, LLC, Johnson & Johnson, Takeda, Xcenda, Engage Healthcare, Medical Learning Institute, American Health & Drug Benefits, Center of Excellence Media LLC, Nassau University Medical Center, National Institute for Quality Improvement and Education and St. John's Episcopal Hospital. ERB has relationships with PATH Medical, Total Health Nutrients, Inc. and LLC, Life Extension Foundation, Weill-Cornell Medical College, the Stanley and Fiona Druckenmiller Fund, the American Academy of Anti-aging Medicine Fellowship in Anti-Aging, Regenerative, and Functional Medicine: Master's Degree in Metabolic & Nutritional Medicine in conjunction with the University of South Florida Medical School; the American Academy of Anti-aging Medicine Tarsus Medical Conference; and Douglas Labs, Life Extension Magazine; and has authored a book on weight loss; (3) Their spouses, partners, or children have no financial relationships that may be relevant to the submitted work; and (4) NRS and ERB have no non-financial interests that may be relevant to the submitted work. This does not alter the authors' adherence to all the PLoS ONE policies on sharing data and materials.

Figures

Figure 1
Figure 1. BMI versus Percent Body Fat in Scatter Plot.
Women (red) who fall above red line are obese according to American Society of Bariatric Physicians criteria (DXA percent body fat: ≥30%). Men (blue) who fall above blue horizontal line are obese according to American Society of Bariatric Physicians criteria (DXA percent body fat: ≥25%). The upper left quadrant bordered by red horizontal line (body fat percent = 30%) and black vertical line (BMI = 30) demonstrates large number of women misclassified as “non-obese” by BMI yet “obese” by percent body fat.
Figure 2
Figure 2. Percent Misclassified as Non-obese by BMI Statified by Age, and Sex (n = 539).
Women demonstrate clear correlation between advancing age and increasing percent misclassification, with over half misclassified by age 60–69. This association is not apparent for men.
Figure 3
Figure 3. Receiver Operating Characteristic (ROC) Curve for Using BMI to Predict Obesity for Women.
The area under the curve increases when stratified by sex. Numbers indicate the BMI cutoff value that corresponds to sensitivity/specificity along ROC curve. The BMI cutoff value that maximizes sensitivity and specificity is 24 for females (79% sensitivity and 87% specificity) and 28 for males (72% sensitivity and 83% specificity).
Figure 4
Figure 4. Comparison of Mean Leptin and Mean Insulin Across Percent Body Fat Categories.
There is strong relationship between increased leptin and increased percent body fat, and no relationship between insulin and percent body fat. Error bars represent 95% confidence intervals for mean.

References

    1. Jia H, Lubetkin EI. Trends in quality-adjusted life-years lost contributed by smoking and obesity. Am J Prev Med. 2010;38(2):138–44. - PubMed
    1. Danaei G, Finucane MM, Lu Y, Singh GM, Cowan MJ, et al. National, regional, and global trends in fasting plasma glucose and diabetes prevalence since 1980: Systematic analysis of health examination surveys and epidemiological studies with 370 country-years and 2·7 million participants. Lancet. 2011;378(9785):31–40. - PubMed
    1. Malnick SD, Knobler H. The medical complications of obesity. QJM. 2006;99(9):565–79. - PubMed
    1. Sun Q, Townsend MK, Okereke OI, Franco OH, Hu FB, et al. Adiposity and weight change in mid-life in relation to healthy survival after age 70 in women: prospective cohort study. BMJ. 2009;339:b3796. - PMC - PubMed
    1. Gallagher D, Visser M, Sepulveda D, Pierson RN, Harris T, et al. How useful is body mass index for comparison of body fatness across age, sex, and ethnic groups? Am J Epidemiol. 1996;143(3):228–39. - PubMed

Publication types