

Differential effects of procaspase-3 activating compounds in the induction of cancer cell death
- PMID: 22486564
- PMCID: PMC3348238
- DOI: 10.1021/mp200673n
Differential effects of procaspase-3 activating compounds in the induction of cancer cell death
Abstract
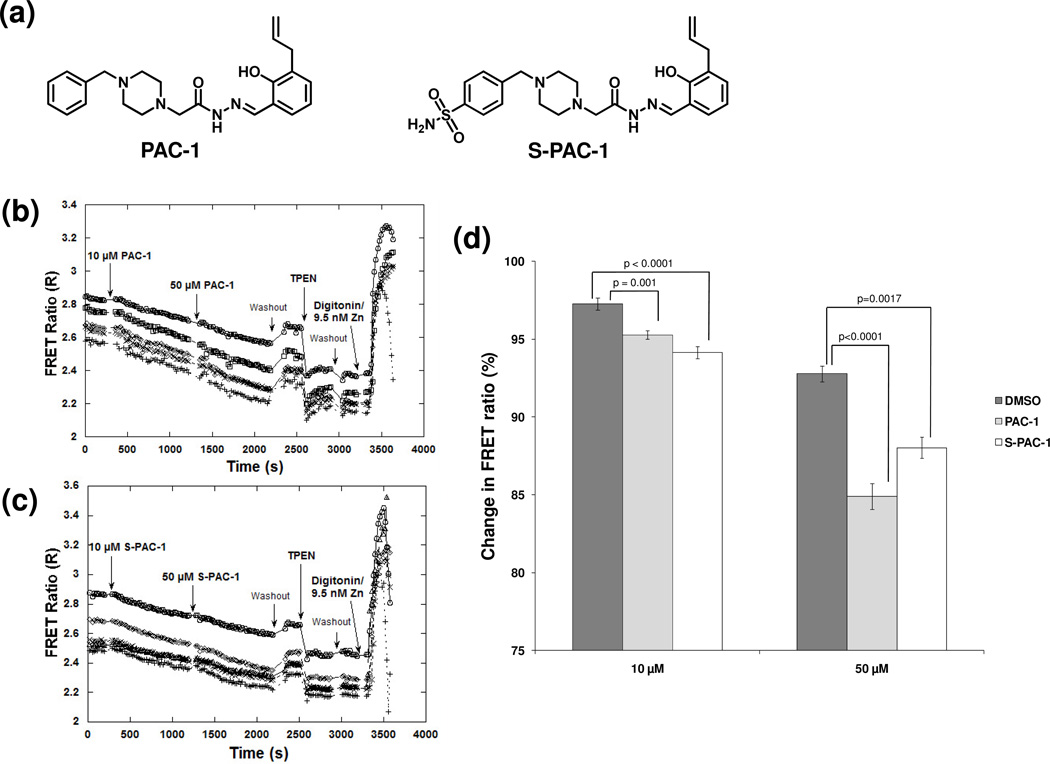
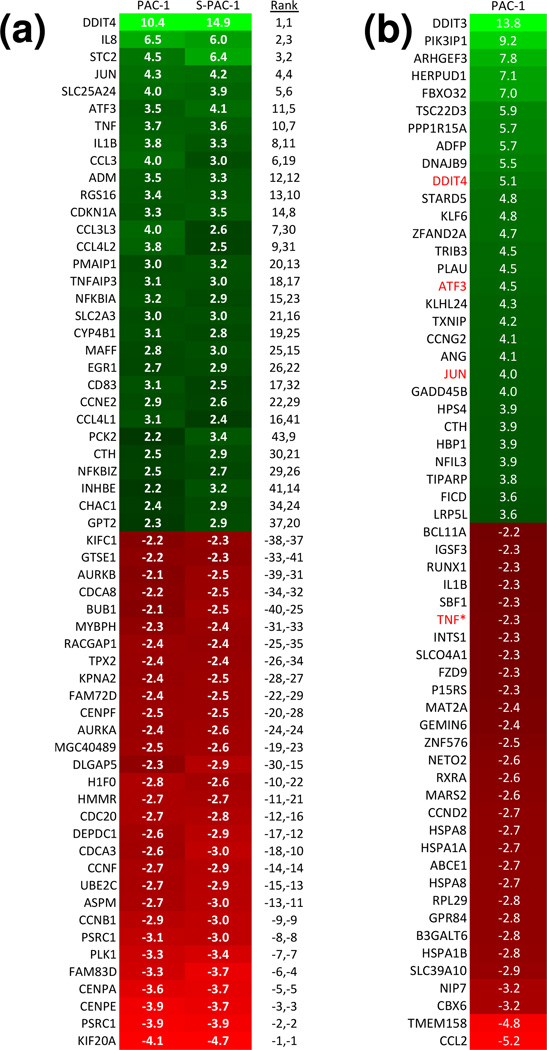
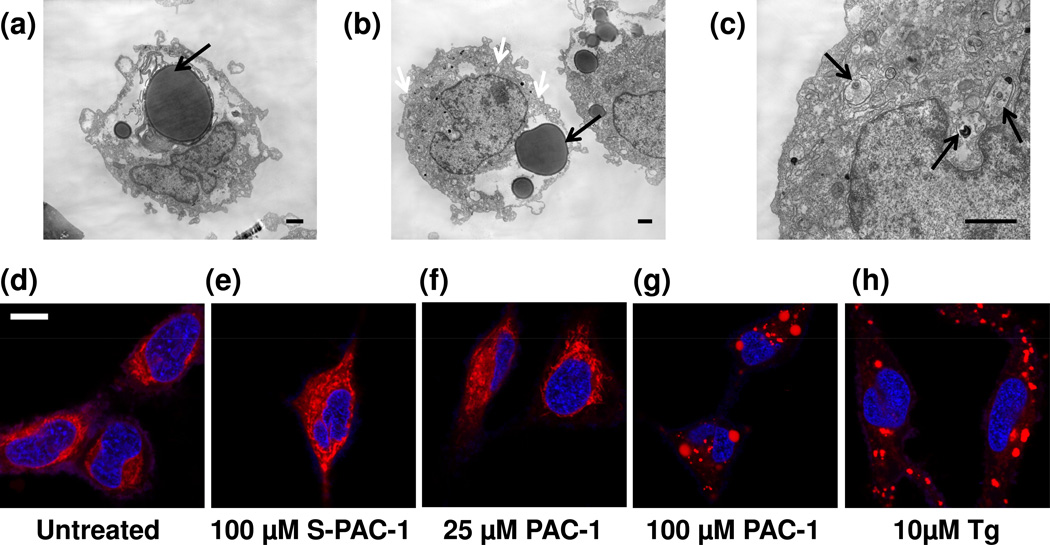
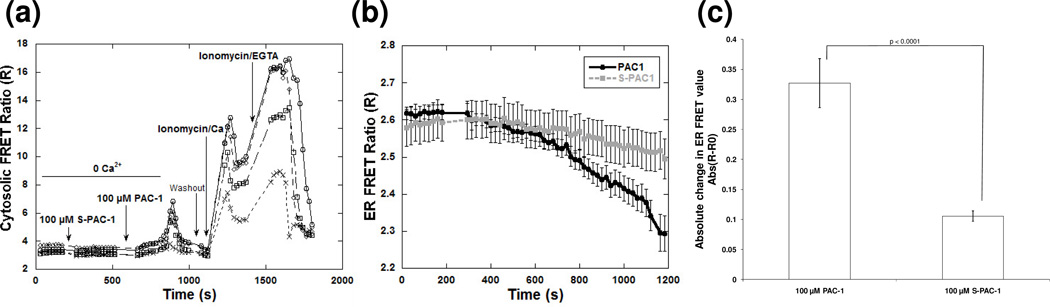
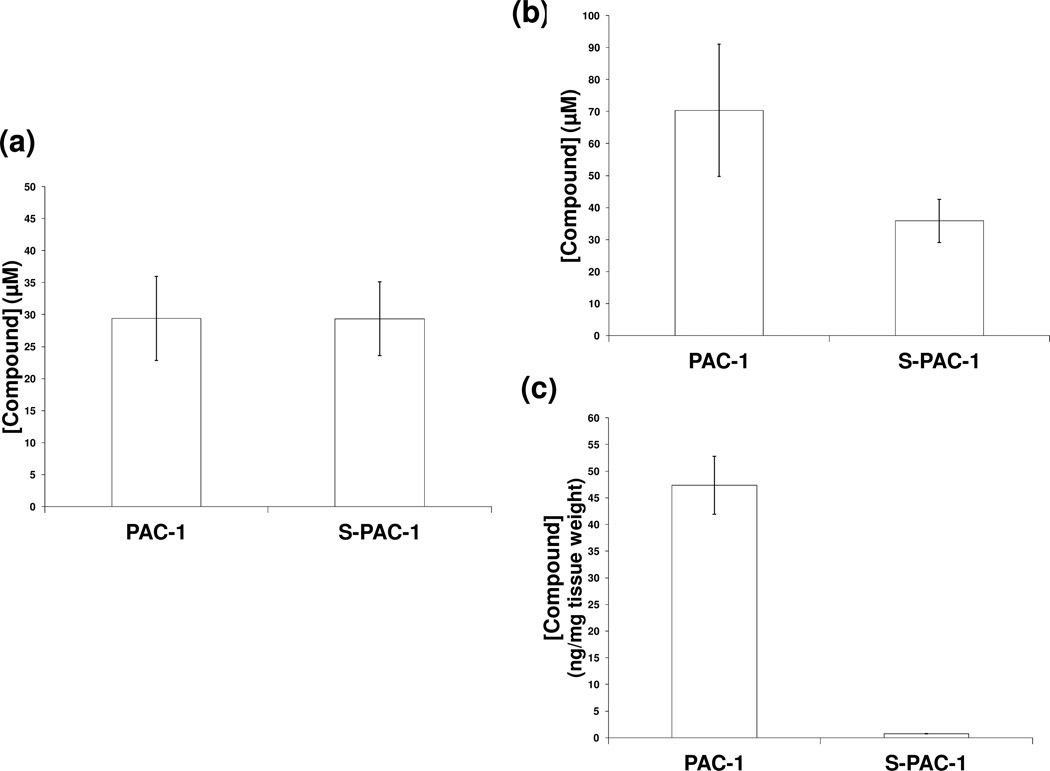
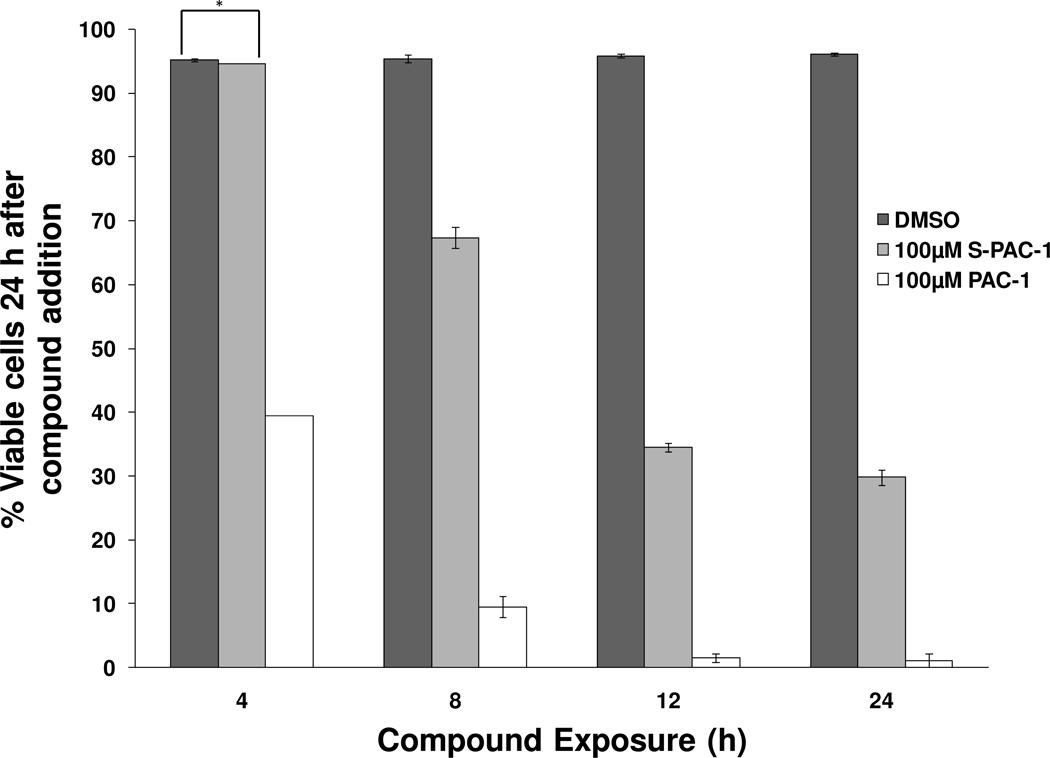
The evasion of apoptosis is a key characteristic of cancer, and thus strategies to selectively induce apoptosis in cancer cells hold considerable promise in personalized anticancer therapy. Structurally similar procaspase activating compounds PAC-1 and S-PAC-1 restore procaspase-3 activity through the chelation of inhibitory zinc ions in vitro, induce apoptotic death of cancer cells in culture, and reduce tumor burden in vivo. Ip or iv administrations of high doses of PAC-1 are transiently neurotoxic in vivo, while S-PAC-1 is safe even at very high doses and has been evaluated in a phase I clinical trial of pet dogs with spontaneously occurring lymphoma. Here we show that PAC-1 and S-PAC-1 have similar mechanisms of cell death induction at low concentrations (less than 50 μM), but at high concentrations PAC-1 displays unique cell death induction features. Cells treated with a high concentration of PAC-1 have a distinctive gene expression profile, unusual cellular and mitochondrial morphology, and an altered intracellular Ca(2+) concentration, indicative of endoplasmic reticulum (ER) stress-induced apoptosis. These studies suggest strategies for anticancer clinical development, specifically bolus dosing for PAC-1 and continuous rate infusion for S-PAC-1.
Conflict of interest statement
No potential conflicts of interest were disclosed.
Figures
Similar articles
-
Procaspase-3 Overexpression in Cancer: A Paradoxical Observation with Therapeutic Potential.ACS Chem Biol. 2019 Nov 15;14(11):2335-2348. doi: 10.1021/acschembio.9b00338. Epub 2019 Jul 16. ACS Chem Biol. 2019. PMID: 31260254 Free PMC article. Review.
-
Procaspase-3 activation as an anti-cancer strategy: structure-activity relationship of procaspase-activating compound 1 (PAC-1) and its cellular co-localization with caspase-3.J Med Chem. 2009 Sep 24;52(18):5721-31. doi: 10.1021/jm900722z. J Med Chem. 2009. PMID: 19708658 Free PMC article.
-
Procaspase-activating compound 1 induces a caspase-3-dependent cell death in cerebellar granule neurons.Toxicol Appl Pharmacol. 2010 Sep 15;247(3):238-42. doi: 10.1016/j.taap.2010.07.002. Epub 2010 Jul 16. Toxicol Appl Pharmacol. 2010. PMID: 20638399
-
ERO1α-dependent endoplasmic reticulum-mitochondrial calcium flux contributes to ER stress and mitochondrial permeabilization by procaspase-activating compound-1 (PAC-1).Cell Death Dis. 2013 Dec 19;4(12):e968. doi: 10.1038/cddis.2013.502. Cell Death Dis. 2013. PMID: 24357799 Free PMC article.
-
Does structural commonality of metal complex formation by PAC-1 (anticancer), DHBNH (anti-HIV), AHL (autoinducer), and UCS1025A (anticancer) denote mechanistic similarity? Signal transduction and medical aspects.J Recept Signal Transduct Res. 2008;28(3):141-52. doi: 10.1080/10799890802084077. J Recept Signal Transduct Res. 2008. PMID: 18569522 Review.
Cited by
-
The combination of PAC-1 and entrectinib for the treatment of metastatic uveal melanoma.Melanoma Res. 2023 Dec 1;33(6):514-524. doi: 10.1097/CMR.0000000000000927. Epub 2023 Sep 22. Melanoma Res. 2023. PMID: 37738028 Free PMC article. Clinical Trial.
-
Procaspase-3 Overexpression in Cancer: A Paradoxical Observation with Therapeutic Potential.ACS Chem Biol. 2019 Nov 15;14(11):2335-2348. doi: 10.1021/acschembio.9b00338. Epub 2019 Jul 16. ACS Chem Biol. 2019. PMID: 31260254 Free PMC article. Review.
-
Immunohistochemical Characterization of Procaspase-3 Overexpression as a Druggable Target With PAC-1, a Procaspase-3 Activator, in Canine and Human Brain Cancers.Front Oncol. 2019 Feb 25;9:96. doi: 10.3389/fonc.2019.00096. eCollection 2019. Front Oncol. 2019. PMID: 30859090 Free PMC article.
-
Small-Molecule Procaspase-3 Activation Sensitizes Cancer to Treatment with Diverse Chemotherapeutics.ACS Cent Sci. 2016 Aug 24;2(8):545-59. doi: 10.1021/acscentsci.6b00165. Epub 2016 Jul 25. ACS Cent Sci. 2016. PMID: 27610416 Free PMC article.
-
Tunable Stability of Imidazotetrazines Leads to a Potent Compound for Glioblastoma.ACS Chem Biol. 2018 Nov 16;13(11):3206-3216. doi: 10.1021/acschembio.8b00864. Epub 2018 Nov 8. ACS Chem Biol. 2018. PMID: 30296373 Free PMC article.
References
-
- Hanahan D, Weinberg RA. The hallmarks of cancer. Cell. 2000;100:57–70. - PubMed
-
- Hanahan D, Weinberg RA. Hallmarks of cancer: the next generation. Cell. 2011;144:646–674. - PubMed
-
- Vassilev LT, Vu BT, Graves B, Carvajal D, Podlaski F, Filipovic Z, Kong N, Kammlott U, Lukacs C, Klein C, Fotouhi N, Liu EA. In vivo activation of the p53 pathway by small-molecule antagonists of MDM2. Science. 2004;303:844–848. - PubMed
-
- Tovar C, Rosinski J, Filipovic Z, Higgins B, Kolinsky K, Hilton H, Zhao X, Vu BT, Qing W, Packman K, Myklebost O, Heimbrook DC, Vassilev LT. Small-molecule MDM2 antagonists reveal aberrant p53 signaling in cancer: implications for therapy. Proc Natl Acad Sci U S A. 2006;103:1888–1893. - PMC - PubMed
-
- Oltersdorf T, Elmore SW, Shoemaker AR, Armstrong RC, Augeri DJ, Belli BA, Bruncko M, Deckwerth TL, Dinges J, Hajduk PJ, Joseph MK, Kitada S, Korsmeyer SJ, Kunzer AR, Letai A, Li C, Mitten MJ, Nettesheim DG, Ng S, Nimmer PM, O'Connor JM, Oleksijew A, Petros AM, Reed JC, Shen W, Tahir SK, Thompson CB, Tomaselli KJ, Wang B, Wendt MD, Zhang H, Fesik SW, Rosenberg SH. An inhibitor of Bcl-2 family proteins induces regression of solid tumours. Nature. 2005;435:677–681. - PubMed
Publication types
MeSH terms
Substances
Grants and funding
LinkOut - more resources
Full Text Sources
Other Literature Sources
Research Materials
Miscellaneous
