. 2012 Nov;36(11):1840-50.
doi: 10.1111/j.1530-0277.2012.01799.x. Epub 2012 Apr 6.

Ethanol metabolism and osmolarity modify behavioral responses to ethanol in C. elegans

Affiliations

Ethanol metabolism and osmolarity modify behavioral responses to ethanol in C. elegans

Joseph T Alaimo et al. Alcohol Clin Exp Res. 2012 Nov.

Abstract

Background: Ethanol (EtOH) is metabolized by a 2-step process in which alcohol dehydrogenase (ADH) oxidizes EtOH to acetaldehyde, which is further oxidized to acetate by aldehyde dehydrogenase (ALDH). Although variation in EtOH metabolism in humans strongly influences the propensity to chronically abuse alcohol, few data exist on the behavioral effects of altered EtOH metabolism. Here, we used the nematode Caenorhabditis elegans to directly examine how changes in EtOH metabolism alter behavioral responses to alcohol during an acute exposure. Additionally, we investigated EtOH solution osmolarity as a potential explanation for contrasting published data on C. elegans EtOH sensitivity.

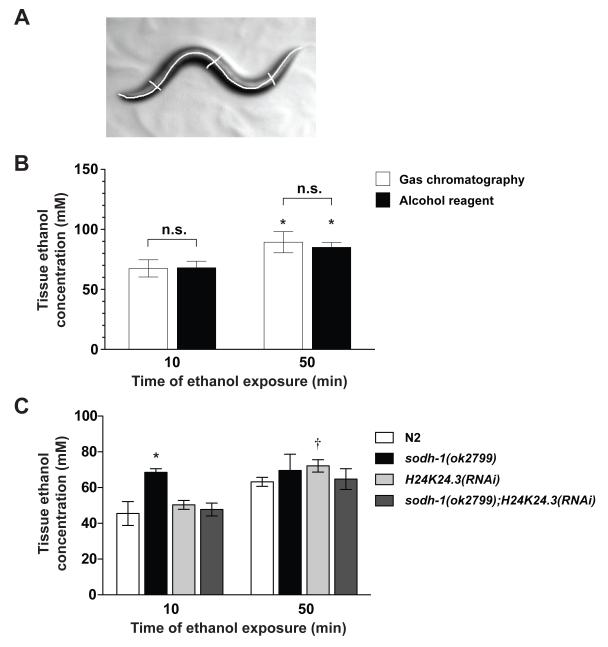
Methods: We developed a gas chromatography assay and validated a spectrophotometric method to measure internal EtOH in EtOH-exposed worms. Further, we tested the effects of mutations in ADH and ALDH genes on EtOH tissue accumulation and behavioral sensitivity to the drug. Finally, we tested the effects of EtOH solution osmolarity on behavioral responses and tissue EtOH accumulation.

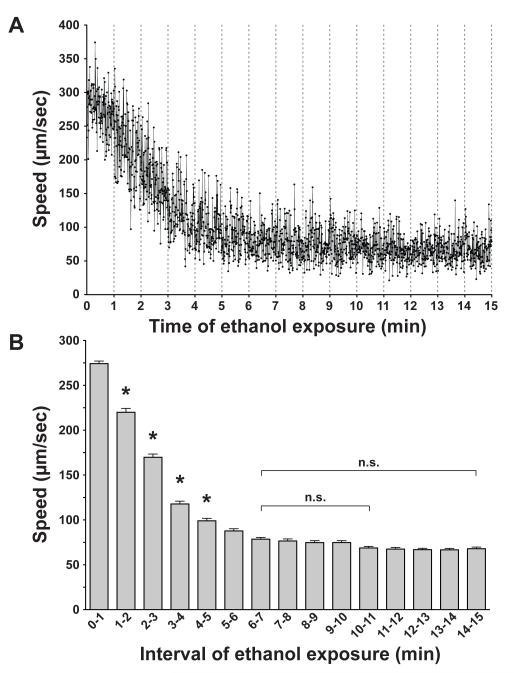
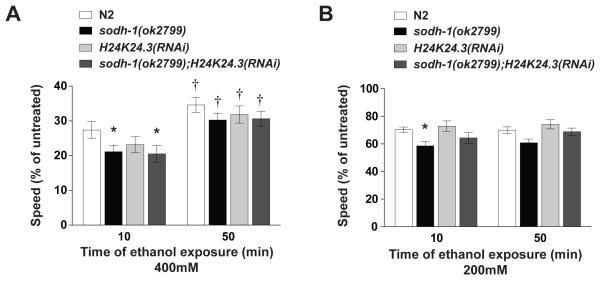
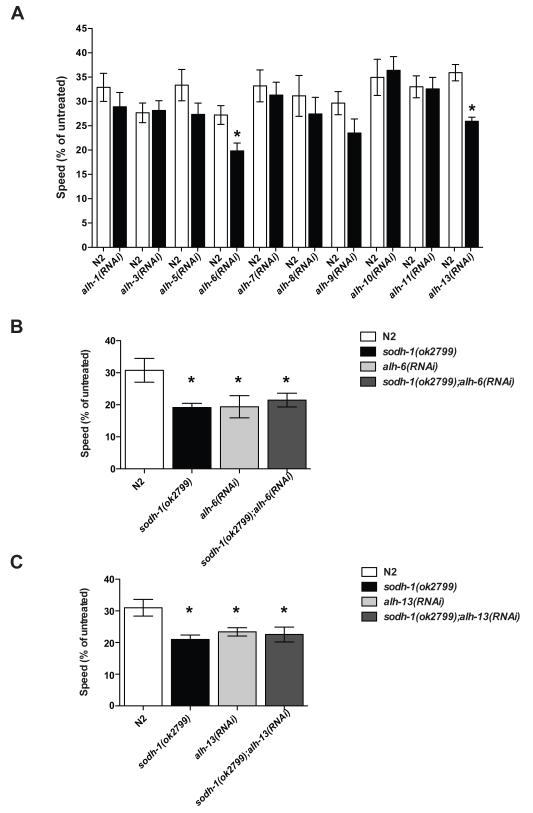
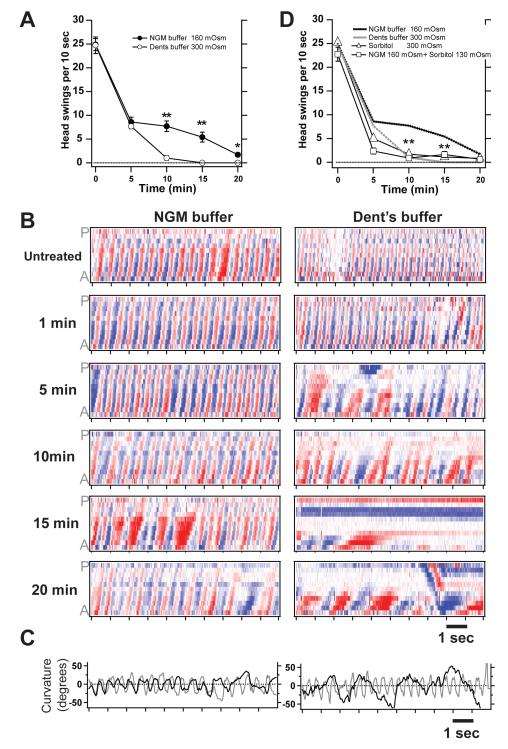
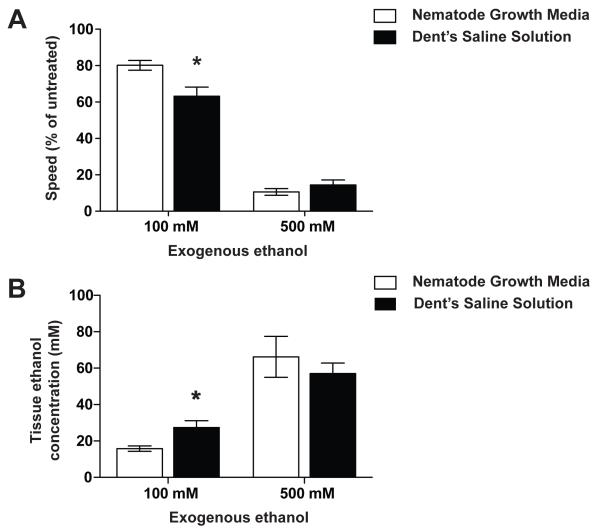
Results: Only a small amount of exogenously applied EtOH accumulated in the tissues of C. elegans and consequently their tissue concentrations were similar to those that intoxicate humans. Independent inactivation of an ADH-encoding gene (sodh-1) or an ALDH-encoding gene (alh-6 or alh-13) increased the EtOH concentration in worms and caused hypersensitivity to the acute sedative effects of EtOH on locomotion. We also found that the sensitivity to the depressive effects of EtOH on locomotion is strongly influenced by the osmolarity of the exogenous EtOH solution.

Conclusions: Our results indicate that EtOH metabolism via ADH and ALDH has a statistically discernable but surprisingly minor influence on EtOH sedation and internal EtOH accumulation in worms. In contrast, the osmolarity of the medium in which EtOH is delivered to the animals has a more substantial effect on the observed sensitivity to EtOH.


Figures

Figure 1
Figure 1. Time course for ethanol effects on speed of locomotion
(a) The mean speed (μm/sec ± SEM) of young adult wild-type animals (n = 6) exposed to 500 mM exogenous ethanol in the absence of food is shown for every 0.5 seconds over a 15-minute period beginning immediately after ethanol exposure. (b) Speeds within each minute of ethanol exposure were binned and a mean (n = 120) calculated for each bin. Significant decreases in speed are only seen in the first 5 minutes when each bin is compared with the previous bin (*, P < 0.01). Bin 6-7 minutes is not significantly different from any bin that follows. n.s., not significantly different.
Figure 2
Figure 2. Determination of internal ethanol concentration in wild-type and ADH compromised animals
(a) An example of worm volume measurements. The volume of a worm was determined by taking photographs of animals immediately before they were used for the biochemical analysis. Each animal was traced (n=10 for each strain) to determine the length, h. The diameter of the animal, d, was the average of three widths, one at the vulva, and one each at the midpoint between the vulva and head or tail. The volume was calculated using formula for the volume of a cylinder (volume = πr2h). (b) There is no difference in internal ethanol concentration measurements using gas chromatograph (GC) and spectrophotometric analysis at 500 mM when actual worm volume was used in the calculation. A significant difference is observed between time points (GC: 10 minutes vs. 50 minutes P < 0.05; Spectrophotometric analysis: 10 minutes vs. 50 minutes P < 0.05). (c) Internal ethanol measurements of 200 worms, treated with 400 mM exogenous ethanol, calculated from spectrophotometric analysis. sodh-1(ok2799) was different from N2 at 10 minutes but not at 50 minutes. H24K24.3(RNAi) was not different from N2 at either timepoint. sodh-1(ok2799);H24K24.3(RNAi) was not different from N2 at either timepoint. * Significantly different from N2 at the same timepoint (P < 0.05) † Significantly different from the same strain across timepoints (P < 0.05).
Figure 3
Figure 3. ADH compromised animals demonstrate behavioral sensitivity to ethanol, and develop acute functional tolerance to ethanol
Animals were treated continuously with exogenous ethanol, beginning at 10 minutes and at 50 minutes of exposure, two-minute digital movies were recorded, and speed was determined by ImagePro image analysis software. A % relative speed was calculated by dividing treated speed by untreated speed, to account for any baseline speed differences. (a) Animals treated with 400 mM exogenous ethanol. Locomotion of wild-type N2 worms is strongly suppressed by this dose of ethanol. sodh-1(ok2799) and sodh-1(ok2799);H24K24.3(RNAi) strains are more strongly affected than N2 by ethanol at this dose, but H24K24.3(RNAi) animals are not significantly different from N2. Additionally, at this dose of ethanol, ADH mutant animals develop acute functional tolerance; each strain moved significantly faster at 50 minutes than at 10 minutes. (b) Animals treated with 200 mM exogenous ethanol. At this dose, sodh-1(ok2799) and sodh-1(ok2799);H24K24.3(RNAi) strains showed enhanced behavioral sensitivity to ethanol relative to N2, but H24K24.3(RNAi) was not different from N2. At this dose, we do not observe development of acute functional tolerance.
Figure 4
Figure 4. Behavioral effects of intoxication in wild-type and ALDH compromised animals
Animals were treated with exogenous ethanol for 10 minutes, two-minute digital movies were recorded, and speed was determined by ImagePro image analysis software. A % relative speed was calculated by dividing treated speed by untreated speed, to account for any baseline speed differences. In each case, the alh knockdown strain was compared to N2 animals tested on the same plates. (a) Knockdown of either alh-6 or alh-13 conferred hypersensitivity to the effects of ethanol on locomotion (*, P < 0.05). (b, c) Knockdown of neither alh-6 nor alh-13 in the background of sodh-1(ok2799) was able to enhance the ethanol sensitivity beyond that of sodh-1(ok2799) alone.
Figure 5
Figure 5. Sensitivity to intoxication while swimming depends on exogenous osmolarity
(a) Time course of intoxication while animals were swimming in 500 mM ethanol. Animals become significantly more immobilized by the same concentration of ethanol in Dent's buffer than in NGM buffer (**, P <0.001). (b) Body curvature matrices during intoxication for one representative animal in NGM buffer and one representative animal in Dent's buffer. Color intensity along the anterior-posterior (A-P) axis versus time represents the amount of bending at given points along the body (red = ventral, white = no bend, blue = dorsal). (c) Plots of neck curvature versus time. Untreated (grey) and 20 minute treatment in ethanol (black). (d) Time course of intoxication while animals were swimming in 500 mM ethanol. NGM and Dent's buffer data are replotted from panel (a). Animals treated with NGM + sorbitol or sorbitol alone were as sensitive to ethanol as those animals treated in Dent's buffer.
Figure 6
Figure 6. Sensitivity to intoxication and tissue accumulation of ethanol while crawling depends on exogenous osmolarity
(a) Animals were treated with exogenous ethanol for 10 minutes, two-minute digital movies were recorded, and speed was determined by ImagePro image analysis software. A % relative speed was calculated by dividing treated speed by untreated speed, to account for any baseline speed differences. Animals exposed to 100 mM exogenous ethanol for 10 minutes on NGM plates were less affected than animals exposed on Dent's Saline plates. (b) Animals exposed to ethanol on NGM plates accumulated significantly more tissue ethanol than animals exposed on Dent's Saline plates.

References

    1. Avery L, Raizen D, Lockery S. Electrophysiological methods. Methods Cell Biol. 1995;48:251–269. - PMC - PubMed
    1. Bargmann CI. Neurobiology of the Caenorhabditis elegans genome. Science. 1998;282:2028–2033. - PubMed
    1. Bettinger JC, McIntire SL. State-dependency in C. elegans. Genes Brain Behav. 2004;3:266–272. - PubMed
    1. Brenner S. The genetics of Caenorhabditis elegans. Genetics. 1974;77:71–94. - PMC - PubMed
    1. Burns AR, Wallace IM, Wildenhain J, Tyers M, Giaever G, Bader GD, Nislow C, Cutler SR, Roy PJ. A predictive model for drug bioaccumulation and bioactivity in Caenorhabditis elegans. Nat Chem Biol. 2010;6:549–557. - PubMed

Publication types

MeSH terms