Review
. 2012 May;17(5):344-64.
doi: 10.1111/j.1365-2443.2012.01596.x. Epub 2012 Apr 4.

RNA plasticity and selectivity applicable to therapeutics and novel biosensor development

Affiliations
Free PMC article
Review

RNA plasticity and selectivity applicable to therapeutics and novel biosensor development

Yoshikazu Nakamura et al. Genes Cells. 2012 May.
Free PMC article

Abstract

Aptamers are short, single-stranded nucleic acid sequences that are selected in vitro from large oligonucleotide libraries based on their high affinity to a target molecule. Hence, aptamers can be thought of as a nucleic acid analog to antibodies. However, several viewpoints hold that the potential of aptamers arises from interesting characteristics that are distinct from, or in some cases, superior to those of antibodies. This review summarizes the recent achievements in aptamer programs developed in our laboratory against basic and therapeutic protein targets. Through these studies, we became aware of the remarkable conformational plasticity and selectivity of RNA, on which the published report has not shed much light even though this is evidently a crucial feature for the strong specificity and affinity of RNA aptamers.


Figures

Figure 1
Figure 1
Overall structure of known aptamer–protein complexes with electrostatic surface potential. The RNA aptamer is a yellow ball-and-stick model. (A) Aptamer–thrombin complex at 1.8-Å resolution (Long et al. 2008). (B) Aptamer–nuclear factor-κB complex at 2.45-Å resolution (Huang et al. 2003). (C) Aptamer–MS2 coat protein complex at 2.8-Å resolution (Horn et al. 2004). (D) Aptamer–Fc region of human IgG1 (hFc1) complex at 2.15-Å resolution (Nomura et al. 2010). ICM Pro (Molsoft, Inc.) produced images of the electrostatic surface potential using the default setting: The potential scale used was 5. Blue areas: positively charged; red areas: negatively charged.
Figure 2
Figure 2
Structure of anti-hFc1 aptamer and the aptamer–hFc1 complex (Nomura et al. 2010). (A) The 2.15-Å crystal structure of a human IgG–aptamer complex. hFc1 backbone molecules are light yellow and gray, and bound aptamers are blue. Of the three regions colored red, orange and green in hFc1 (gray), a previous NMR study (Miyakawa et al. 2008) suggested that the aptamer binds the orange region, and the crystal structure confirms this prediction. (B) hFc1 conformations uncomplexed (gray) and in complex (red) with the aptamer. (C) M-fold-predicted secondary structure of anti-hFc1 aptamer (left) and its crystal structure in the complex (right). The global fold of the aptamer adapts a distorted hairpin structure with base flipping between U6 and G7. (D) Coordination sphere of Ca2+ (red sphere). Ca2+ is bound in a distorted octahedral coordination environment with the phosphate backbone and five water molecules (Nomura et al. 2010).
Figure 3
Figure 3
Neutralizing anti-interleukin (IL)-17A aptamer (Ishiguro et al. 2011). (A) Secondary structure of Apt21-2, predicted by M-fold. Circles denote 2′-fluoro-modified pyrimidines. (B) Suppression of IL-17A-induced signaling pathways in normal human dermal fibroblasts (NHDF cells) by Apt21-2. NHDF cells were treated with human (h)IL-17A (40 ng/mL) with random RNA pool (control) or Apt21-2 RNA (30 nm) and analyzed by Western blotting using the indicated antibodies to detect phosphorylation levels. (C) IL-6 expression affected by Apt21-2 in NHDF cells. hIL-17A was preincubated with Apt21-2 or an anti-hIL-17A antibody at different concentrations and added to NHDF cell culture. After 24-h incubation, the amount of IL-6 secreted to the medium was assessed by ELISA.
Figure 4
Figure 4
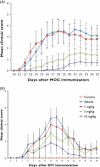
Attenuation of autoimmunity in mouse models by anti-IL-17A aptamer (Ishiguro et al. 2011). (A) Suppression of experimental autoimmune encephalitis (EAE) development by Apt21-2 (Ishiguro et al. 2011). Wild-type mice (n = 10 each) were immunized with myelin oligodendrocyte protein (MOG35–55) peptide in complete Freund’s adjuvant, and PEG21-2idT (0, 1, 3 and 10 mg/kg) was administered i.p. every other day after immunization. EAE clinical scores for vehicle and PEG21-2idT–administered mice. Values are the mean and SEM of 10 mice per group. (B) PEG21-2idT treatment suppresses development of glucose-6-phosphate isomerase (GPI)-induced arthritis. DBA/1 mice were immunized with 300 μg of mouse GPI, and the development of arthritis was monitored visually and scored on a scale of 0–2. Values are the mean and SEM of 10 mice per group.
Figure 5
Figure 5
Reactivity of anti-IL-17 aptamers to homo- or heterodimeric forms of IL-17A and IL-17F (Adachi et al. 2011). (A) Surface plasmon resonance (SPR) sensorgrams of Apt21-2 injected with homodimeric (IL-17A/A or IL-17F/F) and heterodimeric (IL-17A/F) protein complexes. Poly(A)-tailed Apt21-2 was immobilized to the sensor chip, and IL-17 proteins were injected. (B) SPR sensorgrams demonstrating the affinity of AptAF42 to IL-17A/F, IL-17A/A and IL-17F/F. Poly(A)-tailed AptAF42 was immobilized to the sensor chip, and IL-17 proteins were injected. (C) Suppression of GRO-α production in BJ cells by AptAF42d1. IL-17A/F, IL-17A/A and IL-17F/F were preincubated with the aptamers or N30 RNA (control) at the indicated molar ratios and added to BJ cells. After 6-h incubation in BJ cells, secreted GRO-α was analyzed by ELISA. The y-axis denotes the relative amount of GRO-α. The data represent the mean of three independent experiments, and standard deviations are indicated with error bars.
Figure 6
Figure 6
Anti-midkine (MK) aptamer and its therapeutic potential. (A) Clinical scores for wild-type EAE mice administered PBS (n = 5) or 5 mg/kg MKapt (n = 5) after the MOG injection. (B) Flow cytometric analysis of CD4+ CD25+ regulatory T (Treg) cell population expansion using the anti-MK RNA aptamer in vitro. (C) Predicted functional cascade of MK and the anti-MK aptamer.
Figure 7
Figure 7
Binary Cy3 aptamer probe composed of folded modules (Endo & Nakamura 2010). (A) Optimized structure of Cy3apt. Ten nucleotides (white letters in black boxes) represent substitutions from the original Cy3apt sequence to optimize affinity to Cy3. ‘Δ3′GCG’ denotes a 3-base deletion on the 3′ end. ‘Tri-reversion’ indicates three bases that reverted to the original. (B) SPR sensorgrams of Cy3apt binding to Cy3 immobilized on the sensor chip. The indicated concentrations of RNAs were injected at time 0 for 30 s at a flow rate of 10 μL/min. (C) Binary Cy3 aptamer probe to detect target oligonucleotides. Schematic representation of the target oligonucleotide and the binary aptamer probe (I-bin and II-bin). The target oligonucleotide T2 sequence is shown, and the variable linker sequences are boxed. M2-1 and M2-2 are single nucleotide mismatches introduced into T2. Target-binding sequences of the binary probe are depicted as lowercase letters. (D) Detection of target oligonucleotides using the binary probe as SPR signals. Target oligonucleotides (10 μm) with (closed box) or without (open box) the binary probe (16 μm) were subjected to SPR analysis.
Figure 8
Figure 8
Selection of a novel class of RNA–RNA interaction motifs based on a ligase ribozyme with defined modular architecture (Ohuchi et al. 2008). (A) Secondary structures of the parental DSL-U5 ribozyme and its derived libraries. (a) The DSL-U5 ribozyme with the GAAA tetraloop/11-ntR pair essential for the ribozyme activity highlighted in gray. (b) The GAAA loop library with the target GAAA tetraloop and randomized nucleotides highlighted in gray. (c) The C-loop library with the target C-loop motif (C-50) with neighboring single base pairs and randomized nucleotides highlighted in gray. (B) Secondary structure of TectoRNA-derived, homodimer-forming constructs. The target C-loop and the C-loop receptor motifs are enclosed in gray boxes. (C) Autoradiogram of electrophoretic mobility shift assay of the [α-P32]-labeled TectoRNA derivative. Left–right: 0, 50, 100, 200, 400, 800 and 1600 nm of unlabeled RNA were added.
Figure 9
Figure 9
Cell-based selection of RNA aptamer against mouse embryonic stem cells (mESCs; Iwagawa et al. 2011). (A) SELEX schematic of live mESCs combined with counterselection against fully differentiated A-9 cells. (B) Consensus motif conserved in the anti-mESC aptamer L2-2. N, K, Y, and R indicate any 4, G or U, C or U, and A or G nucleotides, respectively. (C) Confocal fluorescence image of the L2-2 aptamer. mESCs before and after treatment for rheumatoid arthritis for 4, 8, or 14 days were stained with the indicated fluorescein-labeled RNA probes and APC-labeled antibodies. DIC images are also shown. Scale bar, 50 μm.

References

    1. Adachi H, Ishiguro A, Hamada M, Sakota E, Asai K, Nakamura Y. Antagonistic RNA aptamer specific to a heterodimeric form of human interleukin-17A/F. Biochimie. 2011;93:1081–1088. - PubMed
    1. Akiyama H, Kachi S, Silva RL, Umeda N, Hackett SF, McCauley D, McCauley T, Zoltoski A, Epstein DM, Campochiaro PA. Intraocular injection of an aptamer that binds PDGF-B: a potential treatment for proliferative retinopathies. J. Cell. Physiol. 2006;207:407–412. - PubMed
    1. Atsumi S, Ikawa Y, Shiraishi H, Inoue T. Design and development of a catalytic ribonucleoprotein. EMBO J. 2001;20:5453–5460. - PMC - PubMed
    1. Babendure JR, Adams SR, Tsien RY. Aptamers switch on fluorescence of triphenylmethane dyes. J. Am. Chem. Soc. 2003;125:14716–14717. - PubMed
    1. Baecher-Allan C, Hafler DA. Suppressor T cells in human diseases. J. Exp. Med. 2004;200:273–276. - PMC - PubMed

Publication types