Quantitative imaging of energy expenditure in human brain
- PMID: 22487547
- PMCID: PMC3325488
- DOI: 10.1016/j.neuroimage.2012.02.013
Quantitative imaging of energy expenditure in human brain
Abstract
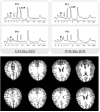
Despite the essential role of the brain energy generated from ATP hydrolysis in supporting cortical neuronal activity and brain function, it is challenging to noninvasively image and directly quantify the energy expenditure in the human brain. In this study, we applied an advanced in vivo(31)P MRS imaging approach to obtain regional cerebral metabolic rates of high-energy phosphate reactions catalyzed by ATPase (CMR(ATPase)) and creatine kinase (CMR(CK)), and to determine CMR(ATPase) and CMR(CK) in pure gray mater (GM) and white mater (WM), respectively. It was found that both ATPase and CK rates are three times higher in GM than WM; and CMR(CK) is seven times higher than CMR(ATPase) in GM and WM. Among the total brain ATP consumption in the human cortical GM and WM, 77% of them are used by GM in which approximately 96% is by neurons. A single cortical neuron utilizes approximately 4.7 billion ATPs per second in a resting human brain. This study demonstrates the unique utility of in vivo(31)P MRS imaging modality for direct imaging of brain energy generated from ATP hydrolysis, and provides new insights into the human brain energetics and its role in supporting neuronal activity and brain function.
Copyright © 2012 Elsevier Inc. All rights reserved.
Figures


References
-
- Attwell D, Laughlin SB. An energy budget for signaling in the grey matter of the brain. J Cereb Blood Flow Metab. 2001;21:1133–1145. - PubMed
-
- Azevedo FA, Carvalho LR, Grinberg LT, Farfel JM, Ferretti RE, Leite RE, Jacob Filho W, Lent R, Herculano-Houzel S. Equal numbers of neuronal and nonneuronal cells make the human brain an isometrically scaled-up primate brain. J Comp Neurol. 2009;513:532–541. - PubMed
-
- Balaban RS, Kantor HL, Katz LA, Briggs RW. Relation between work and phosphate metabolite in the in vivo paced mammalian heart. Science. 1986;232:1121–1123. - PubMed
-
- Bandettini PA, Wong EC, Hinks RS, Tikofsky RS, Hyde JS. Time course EPI of human brain function during task activation. Magn Reson Med. 1992;25:390–397. - PubMed
-
- Biswal B, Yetkin FZ, Haughton VM, Hyde JS. Functional connectivity in the motor cortex of resting human brain using echo-planar MRI. Magn Reson Med. 1995;34:537–541. - PubMed
Publication types
MeSH terms
Grants and funding
- R01 NS057560/NS/NINDS NIH HHS/United States
- P41 RR08079/RR/NCRR NIH HHS/United States
- P41 RR008079/RR/NCRR NIH HHS/United States
- NS041262S1/NS/NINDS NIH HHS/United States
- NS041262/NS/NINDS NIH HHS/United States
- R01 HL050470/HL/NHLBI NIH HHS/United States
- R01 NS070839/NS/NINDS NIH HHS/United States
- R01 EB008699/EB/NIBIB NIH HHS/United States
- NS057560/NS/NINDS NIH HHS/United States
- P30 NS057091/NS/NINDS NIH HHS/United States
- NS070839/NS/NINDS NIH HHS/United States
- HL050470/HL/NHLBI NIH HHS/United States
- P41 EB015894/EB/NIBIB NIH HHS/United States
- NS070839S1/NS/NINDS NIH HHS/United States
- R01 NS041262/NS/NINDS NIH HHS/United States
LinkOut - more resources
Full Text Sources
Other Literature Sources
Research Materials

