. 2012 Jun;71(6):765-75.
doi: 10.1002/ana.22628. Epub 2012 Apr 9.

An operational approach to National Institute on Aging-Alzheimer's Association criteria for preclinical Alzheimer disease

Affiliations

An operational approach to National Institute on Aging-Alzheimer's Association criteria for preclinical Alzheimer disease

Clifford R Jack Jr et al. Ann Neurol. 2012 Jun.

Abstract

Objective: A workgroup commissioned by the Alzheimer's Association (AA) and the National Institute on Aging (NIA) recently published research criteria for preclinical Alzheimer disease (AD). We performed a preliminary assessment of these guidelines.

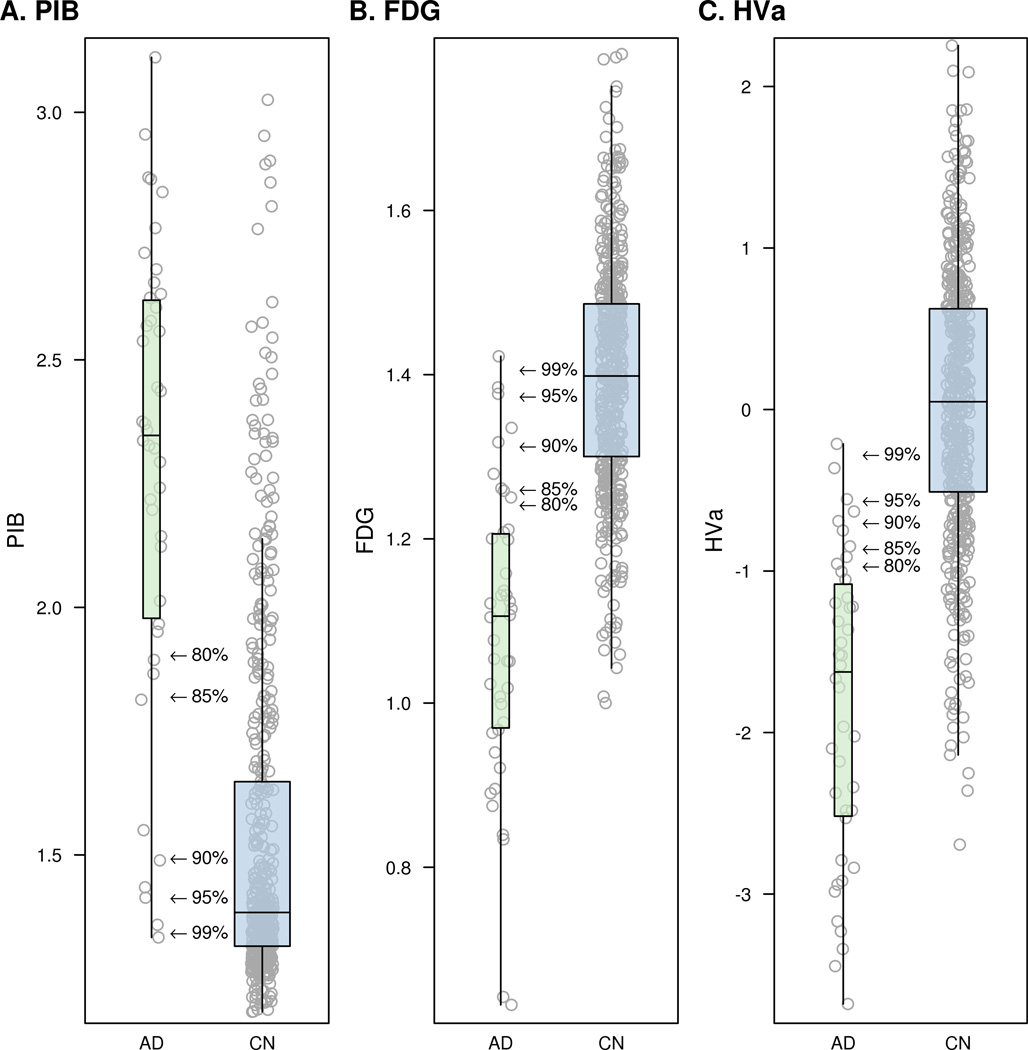
Methods: We employed Pittsburgh compound B positron emission tomography (PET) imaging as our biomarker of cerebral amyloidosis, and (18) fluorodeoxyglucose PET imaging and hippocampal volume as biomarkers of neurodegeneration. A group of 42 clinically diagnosed AD subjects was used to create imaging biomarker cutpoints. A group of 450 cognitively normal (CN) subjects from a population-based sample was used to develop cognitive cutpoints and to assess population frequencies of the different preclinical AD stages using different cutpoint criteria.

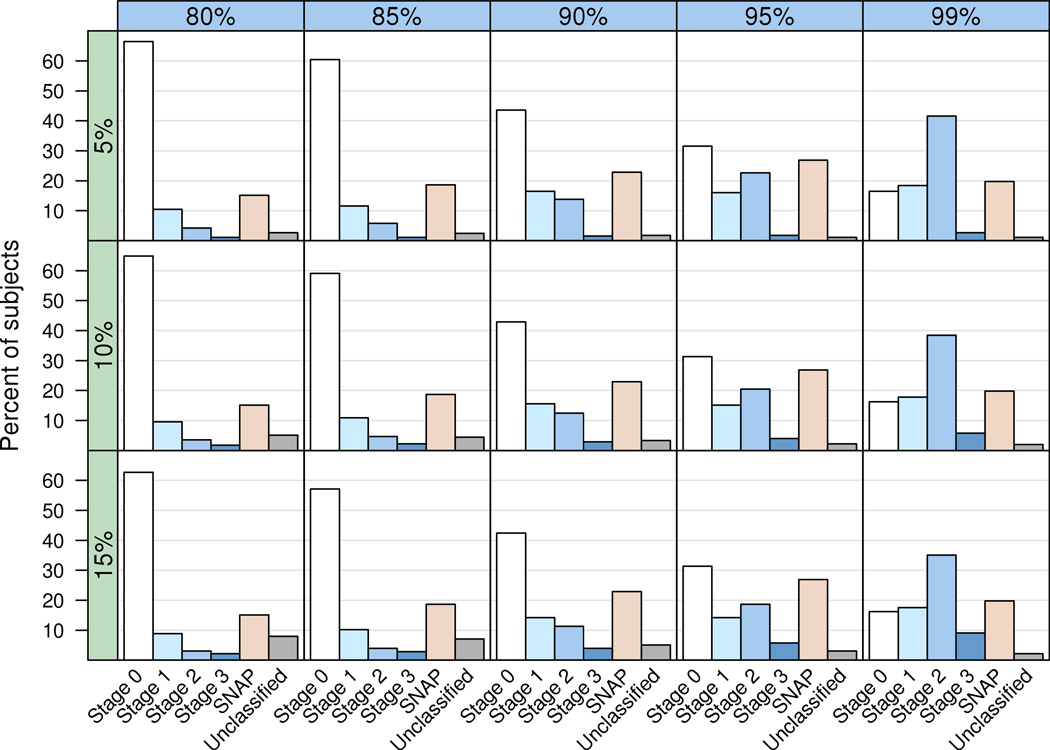
Results: The new criteria subdivide the preclinical phase of AD into stages 1 to 3. To classify our CN subjects, 2 additional categories were needed. Stage 0 denotes subjects with normal AD biomarkers and no evidence of subtle cognitive impairment. Suspected non-AD pathophysiology (SNAP) denotes subjects with normal amyloid PET imaging, but abnormal neurodegeneration biomarker studies. At fixed cutpoints corresponding to 90% sensitivity for diagnosing AD and the 10th percentile of CN cognitive scores, 43% of our sample was classified as stage 0, 16% stage 1, 12 % stage 2, 3% stage 3, and 23% SNAP.

Interpretation: This cross-sectional evaluation of the NIA-AA criteria for preclinical AD indicates that the 1-3 staging criteria coupled with stage 0 and SNAP categories classify 97% of CN subjects from a population-based sample, leaving only 3% unclassified. Future longitudinal validation of the criteria will be important.


Figures

Figure 1
Figure 1
Preclinical stages 1–3 of AD (indicated by the yellow highlighted section) in relation to our model of biomarkers of the AD pathological cascade. The horizontal axis indicates clinical stages of AD: cognitively normal, mildly impaired (MCI), and dementia. The vertical axis indicates the changing values of each biomarker – scaled from maximally normal (bottom) to maximally abnormal (top). Aβ amyloid biomarker is PET amyloid imaging (red line). Biomarkers of neuronal injury are FDG-PET or atrophy on MRI (blue line). Onset or worsening of cognitive symptoms is determined from cognitive testing scores (purple line). The horizontal “cut-points” line represents the cut-points used to operationalize preclinical staging.
Figure 2
Figure 2
Box plots with individual data points for PIB (panel A), FDG (panel B), and HVa (panel C). Arrows in each panel indicate the biomarker cut-points for five levels of AD sensitivity ranging from 80% to 99%.
Figure 3
Figure 3
a. Grid of bar plots showing the percent of CN (n = 450) subjects in each category using the global composite measure for cognitive categorization. The columns of the grid (horizontal blue bars) represent different biomarker sensitivities (80% – 99%) used for cut-points while rows of the grid (vertical green bars) represent different global cognitive summary score percentiles (5% – 15%) used for cut-points. b. Grid of bar plots showing the percent of CN (n = 450) subjects in each category using the memory z-score for cognitive categorization. The columns of the grid (horizontal blue bars) represent different biomarker sensitivities (80% – 99%) used for cut-points while the rows of the grid (vertical green bars) represent different memory z-score cognitive percentiles (5% – 15%) used for cut-points.
Figure 3
Figure 3
a. Grid of bar plots showing the percent of CN (n = 450) subjects in each category using the global composite measure for cognitive categorization. The columns of the grid (horizontal blue bars) represent different biomarker sensitivities (80% – 99%) used for cut-points while rows of the grid (vertical green bars) represent different global cognitive summary score percentiles (5% – 15%) used for cut-points. b. Grid of bar plots showing the percent of CN (n = 450) subjects in each category using the memory z-score for cognitive categorization. The columns of the grid (horizontal blue bars) represent different biomarker sensitivities (80% – 99%) used for cut-points while the rows of the grid (vertical green bars) represent different memory z-score cognitive percentiles (5% – 15%) used for cut-points.
Figure 4
Figure 4
Venn diagram depicting the distribution of all 450 cognitively normal subjects by NIA-AA stage, biomarker and cognitive status

References

    1. Sperling RA, et al. Toward defining the preclinical stages of Alzheimer's disease: Recommendations from the National Institute on Aging and the Alzheimer Assocation Workgroup. Alzheimers Dement. 2011 (Epub ahead of print) - PMC - PubMed
    1. Jack CR, Jr, et al. Hypothetical model of dynamic biomarkers of the Alzheimer's pathological cascade. Lancet Neurol. 2010;9(1):119–128. - PMC - PubMed
    1. Ingelsson M, et al. Early Abeta accumulation and progressive synaptic loss, gliosis, and tangle formation in AD brain. Neurology. 2004;62(6):925–931. - PubMed
    1. Mormino EC, et al. Episodic memory loss is related to hippocampal-mediated beta-amyloid deposition in elderly subjects. Brain. 2009;132(Pt 5):1310–1323. - PMC - PubMed
    1. Perrin RJ, Fagan AM, Holtzman DM. Multimodal techniques for diagnosis and prognosis of Alzheimer's disease. Nature. 2009;461(7266):916–922. - PMC - PubMed

Publication types