

Review
doi: 10.1097/OPX.0b013e31824eeb43.
Optical coherence tomography: future trends for imaging in glaucoma
Affiliations
- PMID: 22488265
- PMCID: PMC3348373
- DOI: 10.1097/OPX.0b013e31824eeb43
Item in Clipboard
Review
Optical coherence tomography: future trends for imaging in glaucoma
Optom Vis Sci.
2012 May.
Abstract
Optical coherence tomography captures a major role in clinical assessment in eye care. Innovative hardware and software improvements in the technology would further enhance its usefulness. In this review, we present several promising initiatives currently in development or early phase of assessment that we expect to have a future impact on optical coherence tomography.
Figures
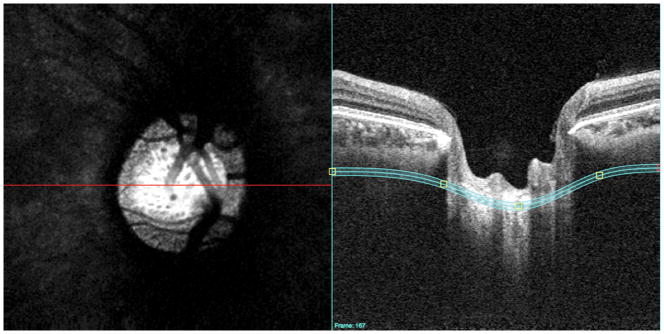
SD-OCT image of optic nerve head in a healthy eye using a 1030nm central wavelength light source. (Right) B-scan showing segmentation plane. (Left) C-mode image highlighting the lamina pore structure.
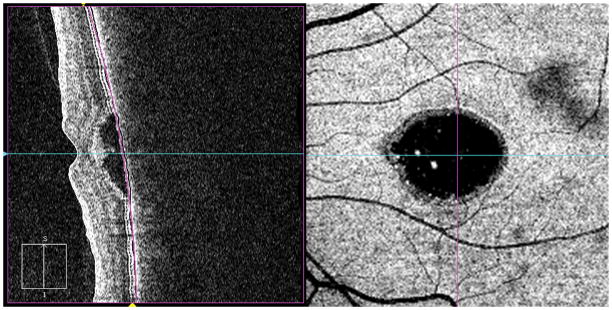
Cirrus HD-OCT 200×200 macular cube scan showing the C-mode plane fit to the retinal pigment epithelial layer to highlight the region of neuroretinal detachment. A color version of this figure is available online at www.optvissci.com .
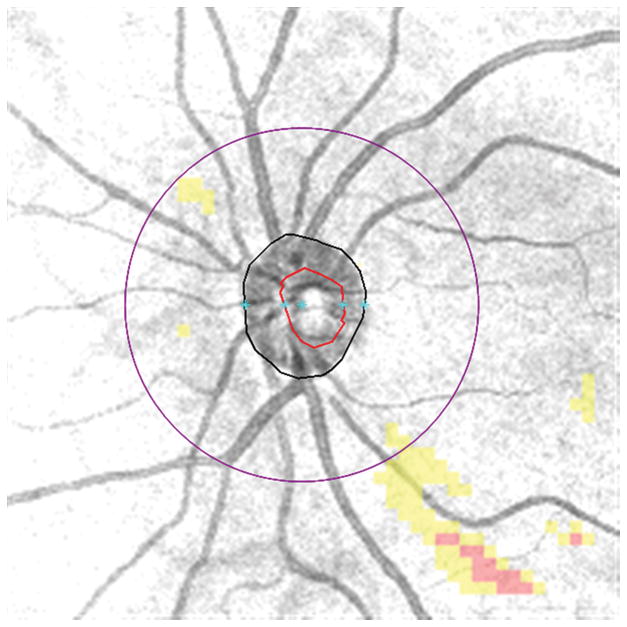
SD-OCT enface image (obtained from Cirrus HD-OCT 200×200 optic disc cube scan) showing 3.4mm diameter circle in purple and glaucomatous wedge defect in the inferotemporal region. The damage that is shown to be outside the normal range (red clusters) does not intersect the 3.4mm circle. A color version of this figure is available online at www.optvissci.com .
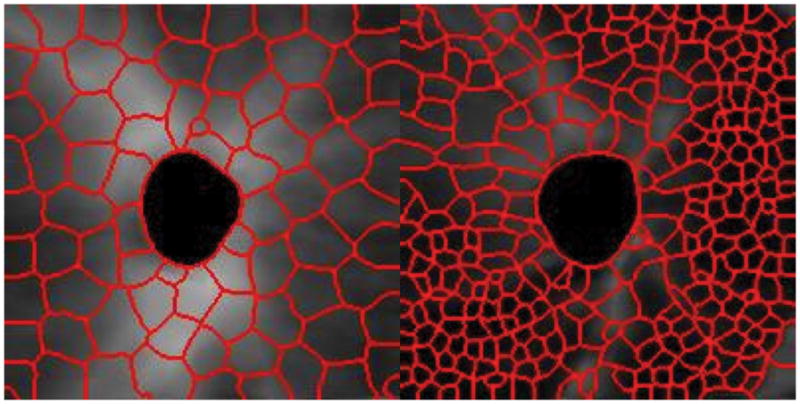
Retinal nerve fiber layer (RNFL) thickness map of the peripapillary region, overlaid with superpixel analysis. (Left) Superpixel analysis of a healthy eye showing uniform clustering. (Right) Superpixel analysis of a glaucomatous eye showing smaller superpixels in areas of thin RNFL. A color version of this figure is available online at www.optvissci.com .
Similar articles
-
Optical Coherence Tomography Angiography in Glaucoma Care.Curr Eye Res. 2018 Sep;43(9):1067-1082. doi: 10.1080/02713683.2018.1475013. Epub 2018 May 23. Curr Eye Res. 2018. PMID: 29757019 Review.
-
Macular imaging with optical coherence tomography in glaucoma.Surv Ophthalmol. 2020 Nov-Dec;65(6):597-638. doi: 10.1016/j.survophthal.2020.03.002. Epub 2020 Mar 19. Surv Ophthalmol. 2020. PMID: 32199939 Free PMC article. Review.
-
Imaging of the retinal nerve fibre layer with spectral domain optical coherence tomography for glaucoma diagnosis.Br J Ophthalmol. 2011 Jul;95(7):909-14. doi: 10.1136/bjo.2010.186924. Epub 2010 Oct 28. Br J Ophthalmol. 2011. PMID: 21030413 Free PMC article. Review.
-
[Optical biopsy of the retina in vivo: on optical coherence tomography and its clinical use in ophthalmology].Orv Hetil. 2005 May 22;146(21):1157-63. Orv Hetil. 2005. PMID: 15991680 Review. Hungarian.
-
Optical coherence tomography errors in glaucoma: preanalytical errors.J Glaucoma. 2010 Mar;19(3):227. doi: 10.1097/IJG.0b013e3181c29b66. J Glaucoma. 2010. PMID: 20935534 No abstract available.
Cited by
-
Three-dimensional spectral-domain optical coherence tomography data analysis for glaucoma detection.PLoS One. 2013;8(2):e55476. doi: 10.1371/journal.pone.0055476. Epub 2013 Feb 11. PLoS One. 2013. PMID: 23408988 Free PMC article.
-
Glaucoma: the retina and beyond.Acta Neuropathol. 2016 Dec;132(6):807-826. doi: 10.1007/s00401-016-1609-2. Epub 2016 Aug 20. Acta Neuropathol. 2016. PMID: 27544758 Free PMC article. Review.
-
Effects of Age, Race, and Ethnicity on the Optic Nerve and Peripapillary Region Using Spectral-Domain OCT 3D Volume Scans.Transl Vis Sci Technol. 2018 Nov 27;7(6):12. doi: 10.1167/tvst.7.6.12. eCollection 2018 Nov. Transl Vis Sci Technol. 2018. PMID: 30510856 Free PMC article.
-
Fabricating customized hydrogel contact lens.Sci Rep. 2016 Oct 17;6:34905. doi: 10.1038/srep34905. Sci Rep. 2016. PMID: 27748361 Free PMC article.
-
Investigation of middle ear anatomy and function with combined video otoscopy-phase sensitive OCT.Biomed Opt Express. 2016 Jan 5;7(2):238-50. doi: 10.1364/BOE.7.000238. eCollection 2016 Feb 1. Biomed Opt Express. 2016. PMID: 26977336 Free PMC article.
References
-
- Hee MR, Izatt JA, Swanson EA, Huang D, Schuman JS, Lin CP, Puliafito CA, Fujimoto JG. Optical coherence tomography of the human retina. Arch Ophthalmol. 1995;113:325–32. - PubMed
-
- Wojtkowski M, Leitgeb R, Kowalczyk A, Bajraszewski T, Fercher AF. In vivo human retinal imaging by Fourier domain optical coherence tomography. J Biomed Opt. 2002;7:457–63. - PubMed
-
- Drexler W, Fujimoto JG. State-of-the-art retinal optical coherence tomography. Prog Retin Eye Res. 2008;27:45–88. - PubMed
-
- Schuman JS, Hee MR, Arya AV, Pedut-Kloizman T, Puliafito CA, Fujimoto JG, Swanson EA. Optical coherence tomography: a new tool for glaucoma diagnosis. Curr Opin Ophthalmol. 1995;6:89–95. - PubMed
Publication types
MeSH terms
Grants and funding
LinkOut - more resources
Full Text Sources
Medical
