. 2012 May;30(5):833-44.
doi: 10.1002/stem.1058.

Radiation-induced reprogramming of breast cancer cells

Affiliations

Radiation-induced reprogramming of breast cancer cells

Chann Lagadec et al. Stem Cells. 2012 May.

Abstract

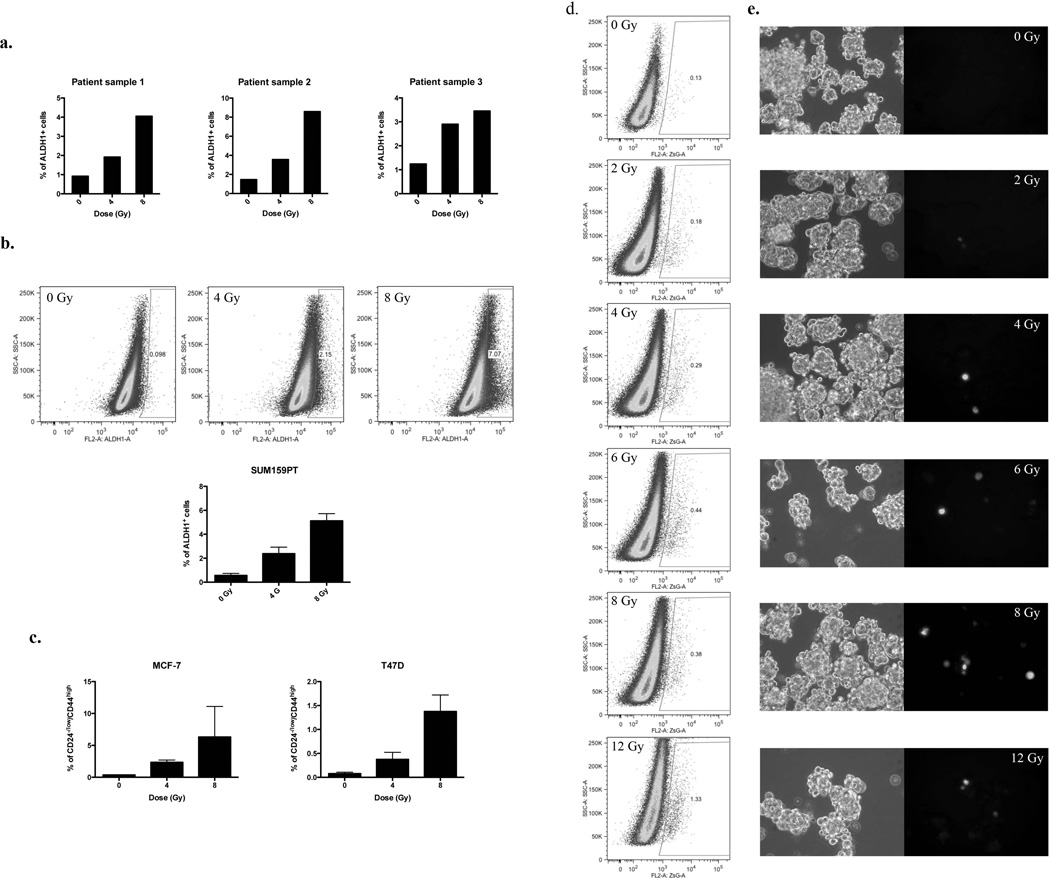
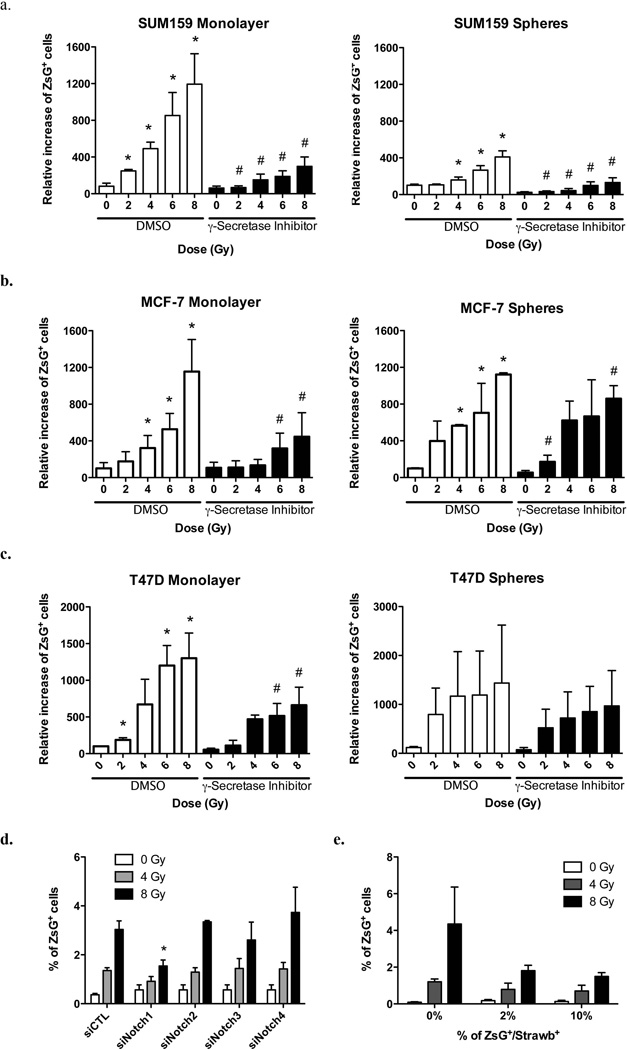
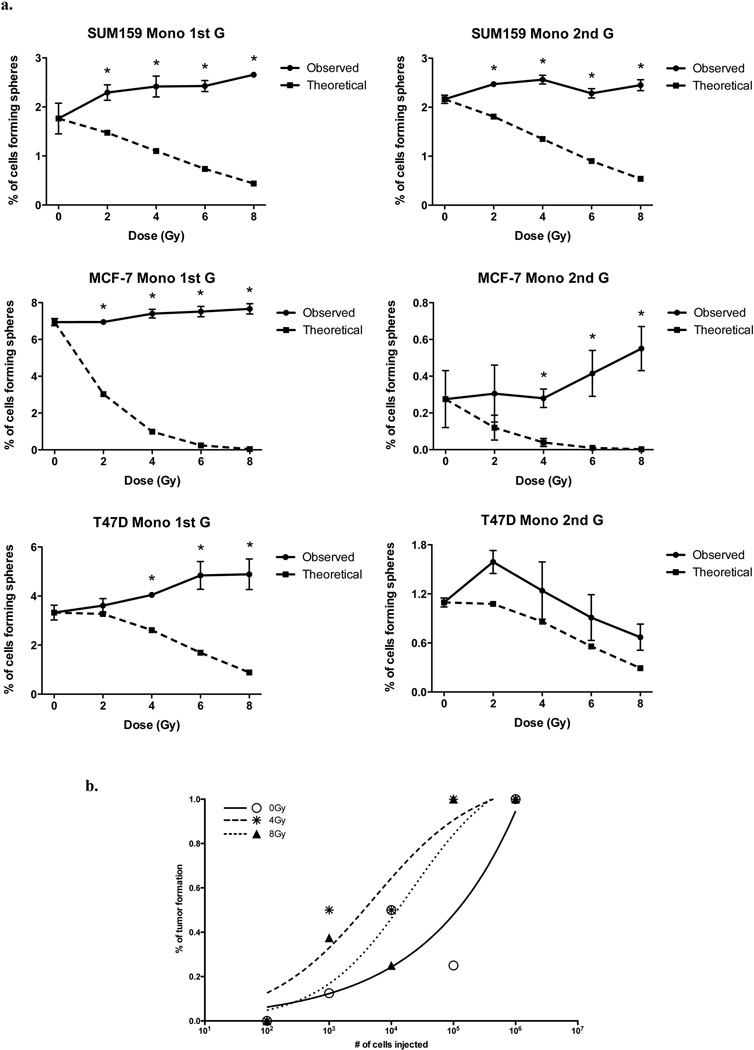
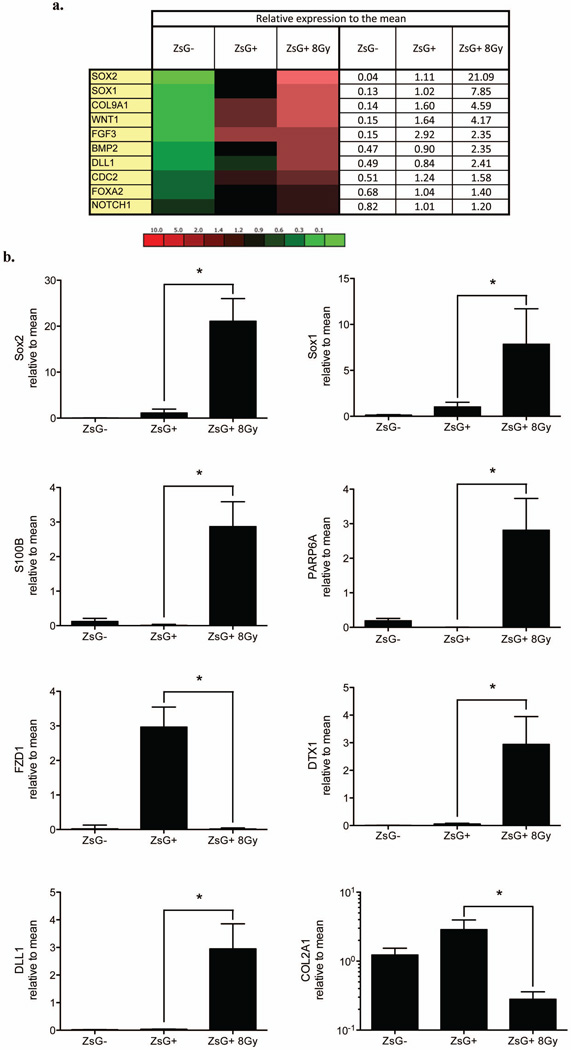
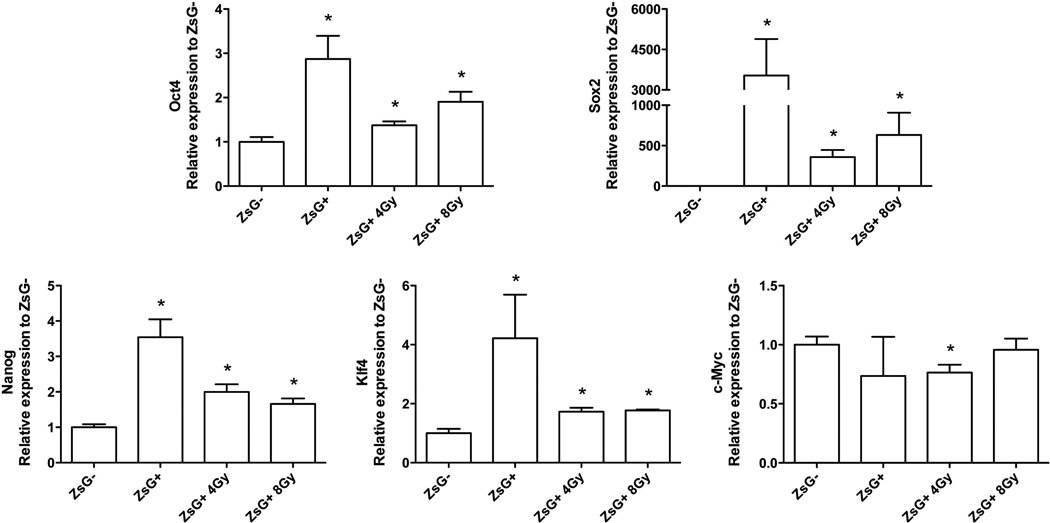
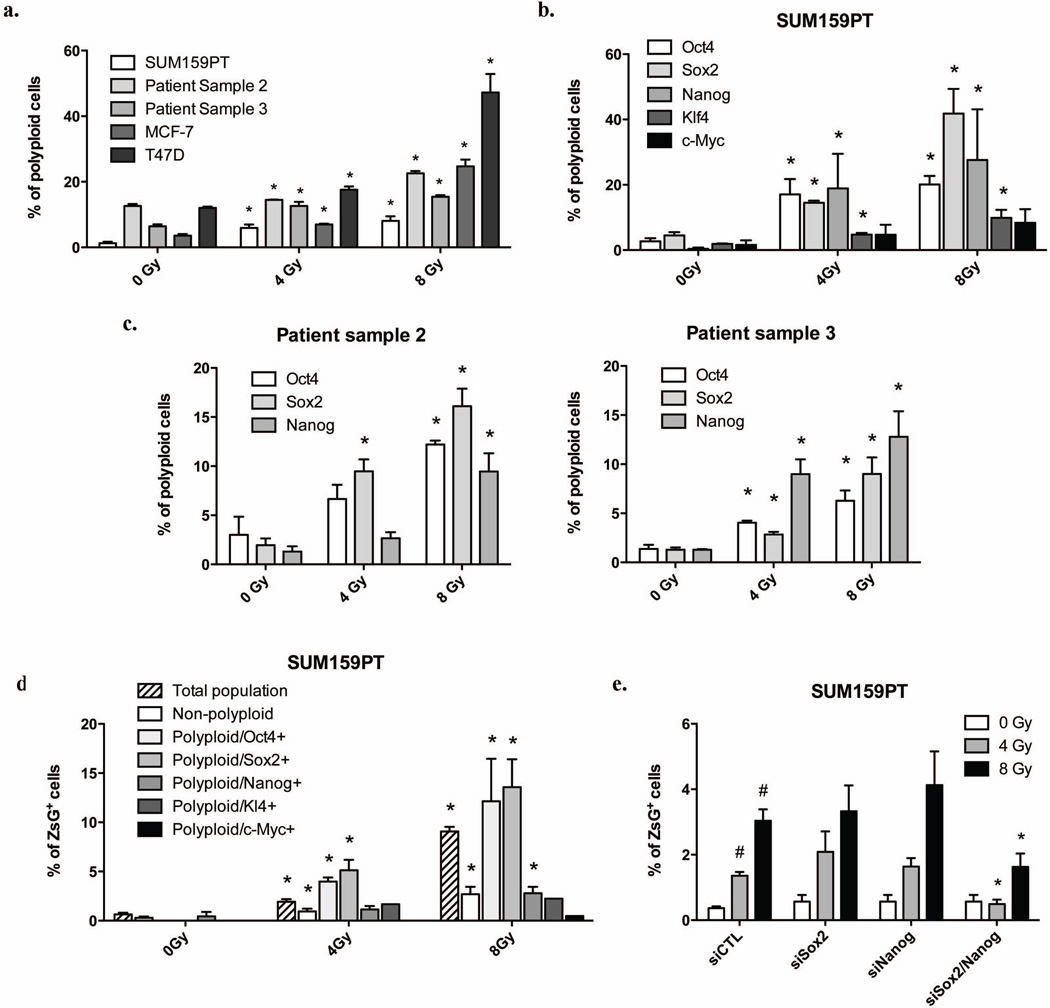
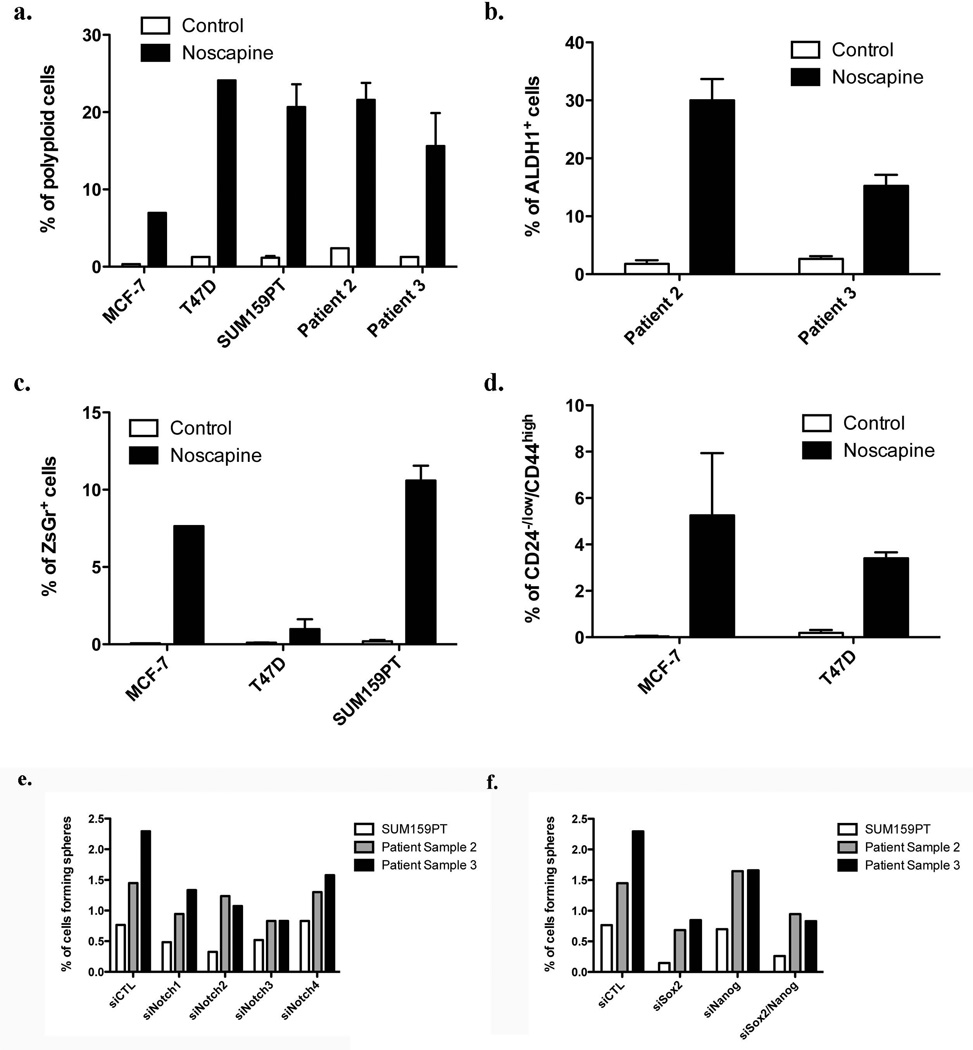
Breast cancers are thought to be organized hierarchically with a small number of breast cancer stem cells (BCSCs) able to regrow a tumor while their progeny lack this ability. Recently, several groups reported enrichment for BCSCs when breast cancers were subjected to classic anticancer treatment. However, the underlying mechanisms leading to this enrichment are incompletely understood. Using non-BCSCs sorted from patient samples, we found that ionizing radiation reprogrammed differentiated breast cancer cells into induced BCSCs (iBCSCs). iBCSCs showed increased mammosphere formation, increased tumorigenicity, and expressed the same stemness-related genes as BCSCs from nonirradiated samples. Reprogramming occurred in a polyploid subpopulation of cells, coincided with re-expression of the transcription factors Oct4, sex determining region Y-box 2, Nanog, and Klf4, and could be partially prevented by Notch inhibition. We conclude that radiation may induce a BCSC phenotype in differentiated breast cancer cells and that this mechanism contributes to increased BCSC numbers seen after classic anticancer treatment.


Figures

Figure 1
Figure 1. Radiation induces de novo generation of CSCs
(a) Freshly isolated patient samples and (b) SUM159PT cells were stained for ALDH1 activity. ALDH1-negative cells were sorted, plated as monolayer cultures and irradiated with 0, 4, or 8Gy the following day. The presence of ALDH1-positive (ALDH1+) cells was analyzed 5 days after irradiation. Percentages of ALDH1-positive cells are show for 3 patient samples. Representative dot blots of SUM159PT and means of ALDH1-positive (ALDH1+) SUM159PT are shown (n=3). (c) MCF-7 and T47D were stained for CD24 and CD44, and purged by flow cytometry from CD24−/low/CD44high cells. Cells were then plated as monolayers and irradiated the following day with 0, 4, or 8Gy. Five days after treatment, cells were stained for CD24 and CD44, and the presence of CD24−/low/CD44high cells was analyzed by FACS. ZsGreen-cODC-negative cells from SUM159PT were sorted and plated as monolayers or mammospheres. The following day, cells were irradiated. Five days after treatment, the presence of ZsGreen-cODC-positive cells was analyzed by flow cytometry. (d) Representative dot blots and (e) pictures (phase contrast and green fluorescence) of SUM159PT-ZsGreen-cODC mammospheres 5 days after irradiation are shown. Means, s.e.m. and p-value for relative increases of ZsGreen-cODC-positive cell numbers are shown in supplementary table 1 and 2.
Figure 2
Figure 2. Radiation induces Notch-dependent de novo generation of CSCs
(a) SUM159PT-, (b) MCF-7-, and (c) T47D-ZsGreen-cODC-negative cells were sorted and plated as monolayers or mammospheres. The following day, cells were then treated with 0, 2, 4, 6, 8, or 12 Gy (dose rate: 2.789 Gy/min). 1h before irradiation and every day after irradiation, cells were treated with a γ-secretase inhibitor (5µM). Five day after treatment, the presence of ZsG-cODC positive cells was analyzed by FACS. The mean for relative increases in ZsG-cODC positive cell numbers are shown (* and # indicates p<0.05, see supplementary table 1 and 2 for means, 95% CI and P value). (d) SUM159PT cells were transfected with Notch1, Notch2, Notch3, or Notch4-specific siRNA, and then sorted for ZsGreen-cODC-negative cells. Cells were plated as monolayers and irradiated with 0, 4, or 8 Gy the following day. Presence of ZsGreen-cODC-positive cells was analyzed 5 days after treatment. The mean percentage of ZsGreen-cODC-positive cell numbers are shown (*indicates p<0.05, n=4). (e) SUM159PT-ZsGreen-cODC cells were transfected with constitutively expressed Strawberry-Red vector. ZsGreen-cODC-positive/StrawberryRed-positive cells were isolated by follow cytometry and mixed with SUM159PT-ZsGreen-cODC-negative (Non-StrawberryRed transfected) cells at different concentration (0, 2, or 10%). Cells were plated and irradiated the following day. Five days after irradiation, the presence of ZsGreen-cODC-positive/StrawberryRed-negative cells was assessed by FACS. The mean percentages of ZsGreen-cODC-positive/StrawberryRed-negative cell numbers are shown (n=3).
Figure 3
Figure 3. Radiation induces de novo generation of functional CSCs
ZsGreen-cODC-negative cells from SUM159PT, MCF-7, and T47D were sorted and plated as monolayers or mammospheres (See Supplementary figure 3b). The following day, cells were irradiated. (a) Five days after irradiation, MCF-7, T47D, and SUM159PT cells were seeded at clonal densities to assess sphere-forming capacity. Means and s.e.m. are shown, *indicates p<0.05. Dark line graphs represent the mean of number of mammospheres observed (n=3), dashed lines represent the number of mammospheres expected to derive from contaminating BCSCs. Secondary sphere forming capacity was assessed 15 days after irradiation. (b) SUM159PT-ZsGreen-cODC-negative cells were sorted and plated as monolayer cultures. The following day, cells were irradiated with 0, 4, or 8 Gy. Five days after irradiation, cells were injected subcutaneously into nude mice. 13 weeks after injection, TC50 values were calculated.
Figure 4
Figure 4. Stem cell gene expression of BCSCs and iBSCS
Expression of 86 stem cell related genes and 10 housekeeping genes was analyzed by semi-quantitative RT-PCR in ZsGreen-cODC-negative, -positive cells and iBCSCs (8 Gy). (a) Heat map of differentially expressed genes between ZsGreen-cODC-negative, ZsGreen-cODC-positive cells non-irradiated or iBCSCs 8Gy, and the mean expression (Mean of ZsGreen-cODC-negative cells, non-irradiated ZsGreen-cODC-positive cells and iBCSCs 8Gy cells) are shown (see also supplementary Figure 6). (b) Significant different expression between ZsGreen-cODC-positive non-irradiated BCSCs and iBCSCs 8Gy are shown (n=3), * indicates p<0.05.
Figure 5
Figure 5. iBCSCs overexpress Oct4, Sox2, Nanog, and Klf4, but not c-Myc
SUM159PT-ZsGreen-ODC cells were sorted into ZsGreen-cODC-positive and -negative cells. ZsGreen-cODC-negative cells were plated as monolayers, and irradiated the following day with 4 or 8 Gy. iBCSCs cells were sorted at day 5 post-irradiation. Expression of Oct4, Sox2, Nanog, Klf4, and c-Myc was analyzed by semi-quantitative RT-PCR. The means of transcription factor gene expression levels (n=4) are shown, * indicates p<0.05.
Figure 6
Figure 6. Irradiation-induced polyploid cells express Oct4, Sox2, Nanog, and Klf4 and are enriched for BCSCs
Protein expression levels of ZsGreen-cODC, Oct4, Sox2, Nanog, Klf4 and c-Myc, and DNA content were analyzed by flow cytometry. (a) The means and s.e.m. of radiation-induced polyploid cells are shown. (b) The means and s.e.m. of the number of polyploid Oct4-, Sox2-, Nanog-, Klf4- and c-Myc-positive cells after irradiation are shown. (c) Expression of Oct4, Sox2 and Nanog in polyploid were analyzed in patient derived samples (For MCF-7 and T47D see Supplementary figure 5). (d) Distributions of SUM159PT BCSCs in the total population, the non-polyploid population, in polyploid Oct4-, Sox2-, Nanog-, Klf4-, or c-Myc-positive population are shown (see also Supplementary figure 6 for MCF-7 and T47D). Data are expressed as means and s.e.m., * indicates p<0.05. (e) SUM159PT-ZsGreen-cODC cells were transfected with Sox2 and/or Nanog-targeting siRNA, and ZsGreen-cODC-negative were sorted and irradiated. Means (± s.e.m.) of ZsGreen-cODC-positive cells found 5 days after irradiation are shown. * indicates p<0.05.
Figure 7
Figure 7. Polyploidy induces de novo generation of CSCs
(a) Assessment of noscapine-induced polyploidy in MCF-7, T47D, SUM159PT cell lines and 2 patient derived samples, five days after drug treatment. Non-tumorigenic cells ALDH1-negative patient-derived cells (b), MCF-7-, T47D-, and SUM159PT-ZsGreen-cODC-negative (c), and CD24+/CD44 MCF-7 and T47D cells (d) were treated with noscapine at 0, 25 or 50µM. The presence of iBCSCs was assessed after 5 days by flow cytometry. SUM159PTcell and patient samples 2 and 3 were transfected with specific siRNA targeting Notch receptors (e), or Sox2 and Nanog (f). Scrambled sequences were used as control. Twenty-four hour after transfection, cells were plated for a sphere forming capacity assay. Percentages of cells able to form a sphere are shown for each condition.

References

    1. Al-Hajj M, Wicha MS, Benito-Hernandez A, et al. Prospective identification of tumorigenic breast cancer cells. Proc. Natl Acad. Sci. USA. 2003;100:3983–3988. - PMC - PubMed
    1. Ginestier C, Hur MH, Charafe-Jauffret E, et al. ALDH1 Is a Marker of Normal and Malignant Human Mammary Stem Cells and a Predictor of Poor Clinical Outcome. Cell Stem Cell. 2007;1:555–567. - PMC - PubMed
    1. Charafe-Jauffret E, Ginestier C, Iovino F, et al. Aldehyde dehydrogenase 1-positive cancer stem cells mediate metastasis and poor clinical outcome in inflammatory breast cancer. Clin Cancer Res. 2010;16:45–55. - PMC - PubMed
    1. Marcato P, Dean CA, Pan D, et al. Aldehyde Dehydrogenase Activity of Breast Cancer Stem Cells is Primarily Due to Isoform ALDH1A3 and Its Expression is Predictive of Metastasis. Stem Cells. 2010 - PubMed
    1. Phillips TM, McBride WH, Pajonk F. The response of CD24(-/low)/CD44+ breast cancer-initiating cells to radiation. J Natl Cancer Inst. 2006;98:1777–1785. - PubMed

Publication types

MeSH terms