. 2012 Nov 15;17(10):1351-61.
doi: 10.1089/ars.2011.4334. Epub 2012 May 31.

Peroxiredoxin III and sulfiredoxin together protect mice from pyrazole-induced oxidative liver injury

Affiliations

Peroxiredoxin III and sulfiredoxin together protect mice from pyrazole-induced oxidative liver injury

Soo Han Bae et al. Antioxid Redox Signal. .

Abstract

Aims: To define the mechanisms underlying pyrazole-induced oxidative stress and the protective role of peroxiredoxins (Prxs) and sulfiredoxin (Srx) against such stress.

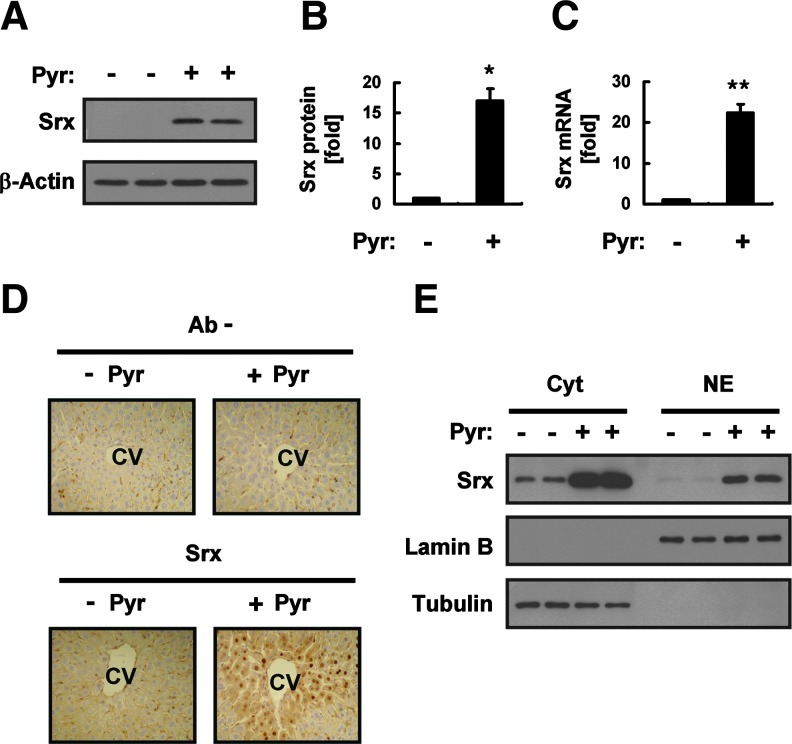
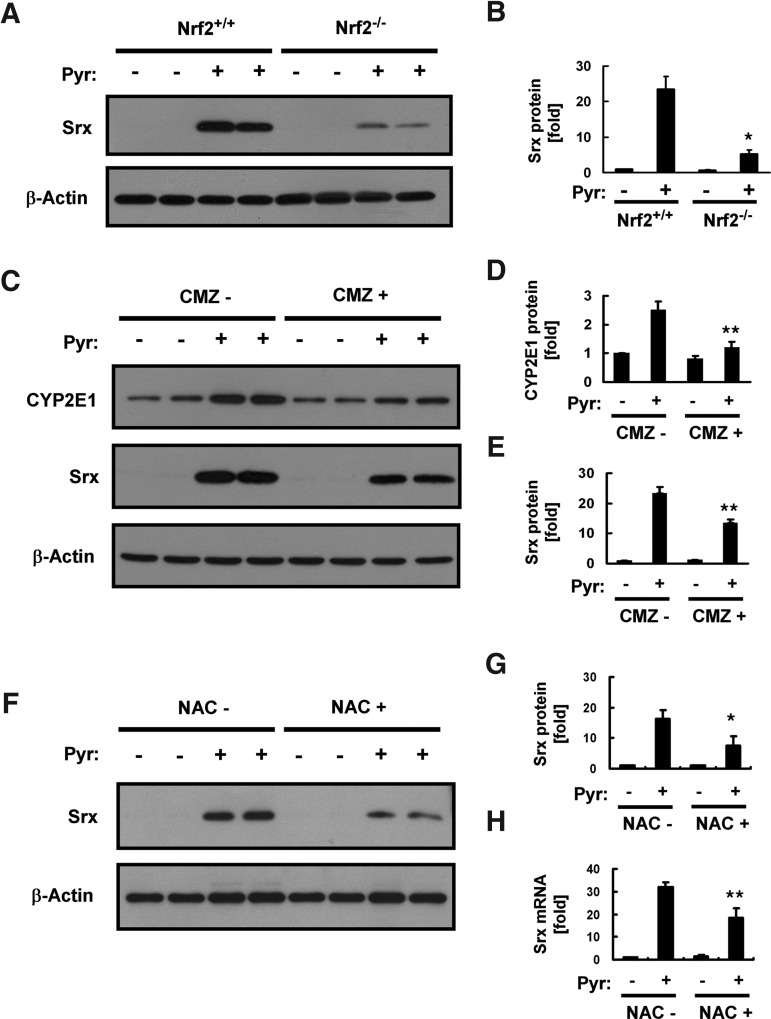
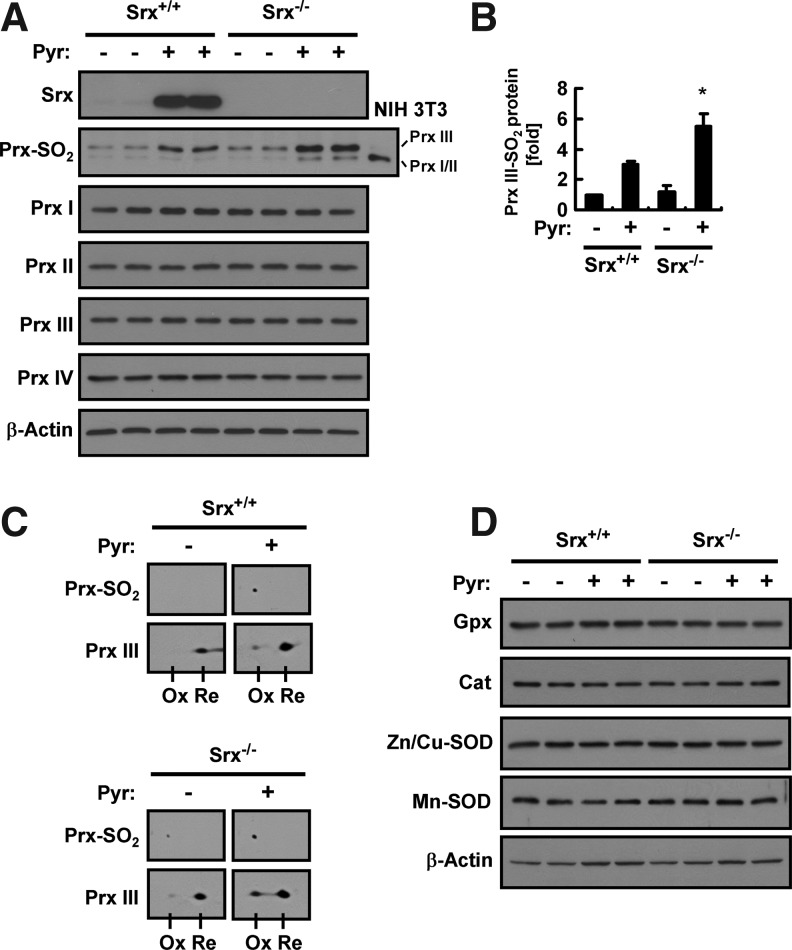
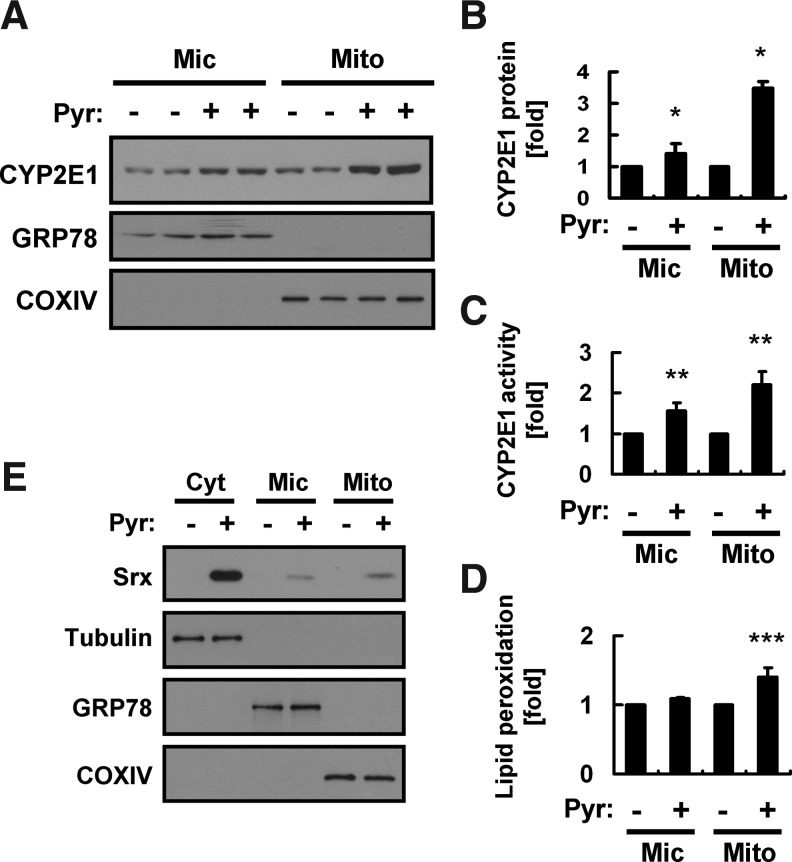
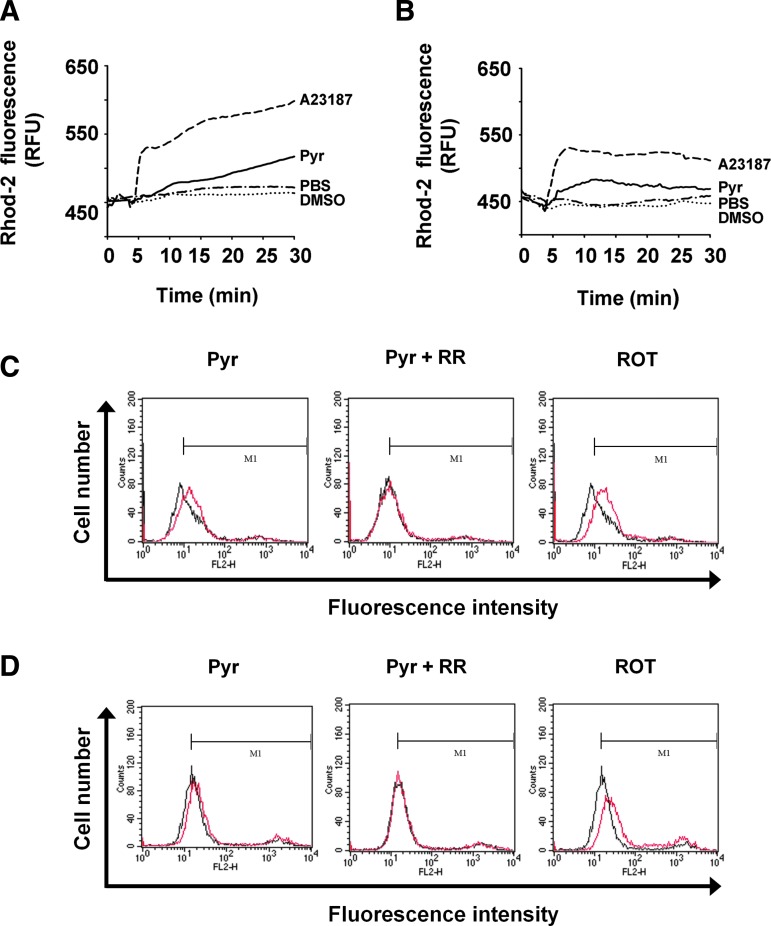
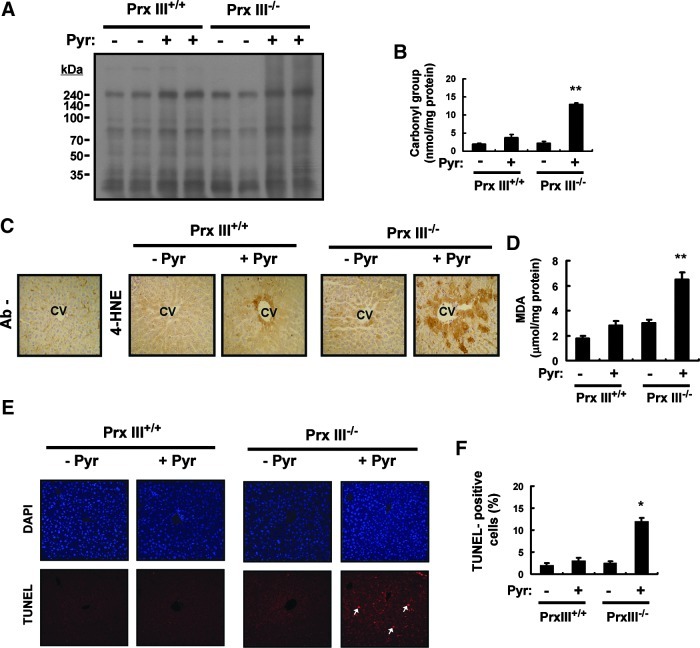
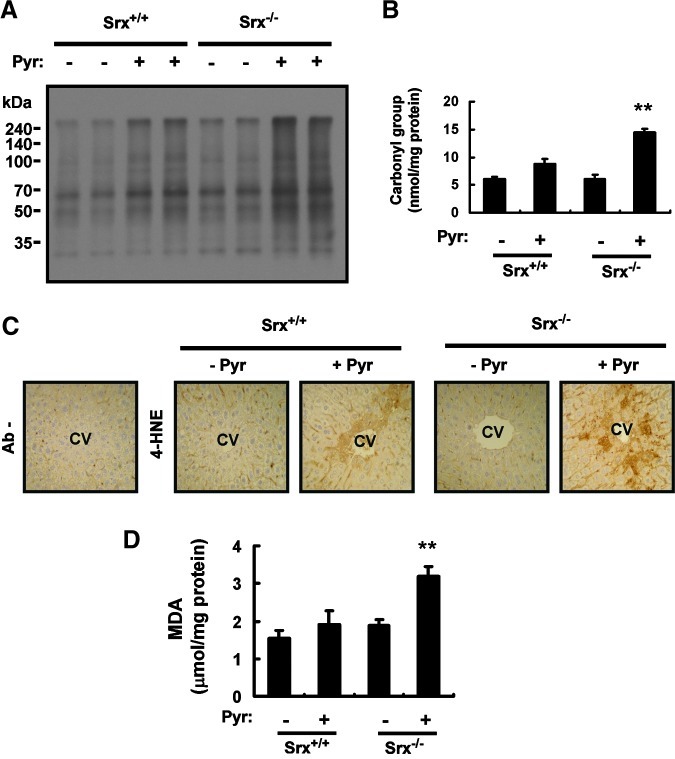
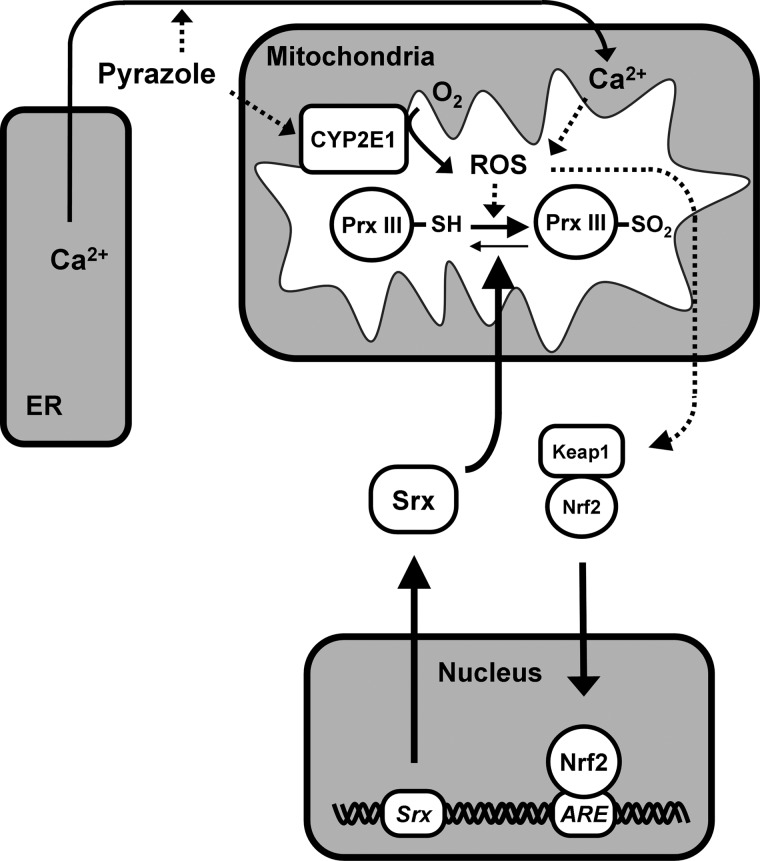
Results: Pyrazole increased Srx expression in the liver of mice in a nuclear factor erythroid 2-related factor 2 (Nrf2)-dependent manner and induced Srx translocation from the cytosol to the endoplasmic reticulum (ER) and mitochondria. Pyrazole also induced the expression of CYP2E1, a primary reactive oxygen species (ROS) source for ethanol-induced liver injury, in ER and mitochondria. However, increased CYP2E1 levels only partially accounted for the pyrazole-mediated induction of Srx, prompting the investigation of CYP2E1-independent ROS generation downstream of pyrazole. Indeed, pyrazole increased ER stress, which is known to elevate mitochondrial ROS. In addition, pyrazole up-regulated CYP2E1 to a greater extent in mitochondria than in ER. Accordingly, among Prxs I to IV, PrxIII, which is localized to mitochondria, was preferentially hyperoxidized in the liver of pyrazole-treated mice. Pyrazole-induced oxidative damage to the liver was greater in PrxIII(-/-) mice than in wild-type mice. Such damage was also increased in Srx(-/-) mice treated with pyrazole, underscoring the role of Srx as the guardian of PrxIII.

Innovation: The roles of Prxs, Srx, and ER stress have not been previously studied in relation to pyrazole toxicity.

Conclusion: The concerted action of PrxIII and Srx is important for protection against pyrazole-induced oxidative stress arising from the convergent induction of CYP2E1-derived and ER stress-derived ROS in mitochondria.


Figures

FIG. 1.
FIG. 1.
Induction of sulfiredoxin (Srx) expression in the liver of mice treated with pyrazole (Pyr). (A) The liver of mice intraperitoneally injected with saline (−) or Pyr (150 mg/kg) was isolated 18 h after the injection, and liver homogenates (20 μg of protein) were subjected to an immunoblot analysis with antibodies to Srx or to β-actin (loading control). Data are representative of three independent experiments. (B) Densitometric analysis of Srx protein expression for the immunoblots similar to those in (A). Data were normalized by the amount of β-actin and then expressed relative to the corresponding mean value for saline-injected mice. Data are mean±standard deviation (SD). *p<0.01 versus the saline group. (C) Total RNA prepared from the liver tissue of mice treated as in (A) was subjected to reverse transcription (RT) and real-time polymerase chain reaction (PCR) analysis for determination of the amounts of Srx mRNA. Data were normalized by the amount of 18S rRNA and then expressed relative to the corresponding value for saline-injected mice. Data are mean±SD. **p<0.02 versus the saline group. (D) Liver sections from mice treated as in (A) were subjected to an immunohistochemical analysis with or without antibodies (Ab−) to Srx with the use of an ABC staining kit (Vector Laboratories, Mississauga, Ontario, Canada). CV, central vein. Original magnification, 100×. (E) The cytosolic and nuclear fractions (20 μg of protein) prepared from the liver tissue of mice treated as in (A) were subjected to an immunoblot analysis with antibodies to Srx, to lamin B, or to tubulin. Data are representative of three independent experiments. (To see this illustration in color the reader is referred to the web version of this article at www.liebertpub.com/ars.)
FIG. 2.
FIG. 2.
Role of nuclear factor erythroid 2–related factor 2 (Nrf2) and CYP2E1 in pyrazole-induced Srx expression in the liver. (A) Homogenates (20 μg of protein) of the liver prepared from Nrf2+/+ or Nrf2−/− mice 18 h after an intraperitoneal injection with saline (−) or pyrazole (150 mg/kg) were subjected to an immunoblot analysis with antibodies specific for either Srx or β-actin. Data are representative of three independent experiments. (B) Densitometric analysis of relative Srx abundance in immunoblots similar to those in (A). Data are means±SD. *p<0.01 versus wild-type mice injected with pyrazole. (C) Wild-type mice were intraperitoneally injected first with chlormethiazole (CMZ, 50 mg/kg) or saline (−) and then 18 h later, with saline (−) or pyrazole (150 mg/kg). Liver homogenates (20 μg of protein) prepared 18 h after the second injection were subjected to an immunoblot analysis with antibodies to CYP2E1, to Srx, or to β-actin. Data are representative of three independent experiments. (D, E) Densitometric analysis of relative CYP2E1 (D) and Srx (E) abundance in immunoblots similar to those in (C). Data are means±SD. **p<0.05 versus corresponding mice injected with pyrazole without the treatment of CMZ. (F) Wild-type mice were intraperitoneally injected with or without NAC (150 mg/kg) before the pyrazole injection (150 mg/kg). Liver homogenates (20 μg of protein) prepared 18 h after the pyrazole injection were subjected to an immunoblot analysis with antibodies specific for either Srx or β-actin. Data are representative of three independent experiments. (G) Densitometric analysis of Srx protein expression for the immunoblots similar to those in (F). Data were normalized by the amount of β-actin and then expressed relative to the corresponding mean value for saline-injected mice. Data are mean±SD. *p<0.03 versus the corresponding mice injected with pyrazole without treatment of NAC. (H) Total RNA prepared from the liver tissue of mice treated as in (F) was subjected to RT and real-time PCR analysis for the determination of the amounts of Srx mRNA. Data were normalized by the amount of 18S rRNA and then expressed relative to the corresponding value for saline-injected mice. Data are mean±SD. **p<0.05 versus the corresponding mice injected with pyrazole without the treatment of NAC.
FIG. 3.
FIG. 3.
Effects of pyrazole on the abundance and hyperoxidation of 2-cysteine (Cys) peroxiredoxins (Prxs) in the liver of Srx+/+ or Srx−/− mice. (A) Liver homogenates (20 μg of protein) prepared 18 h after an intraperitoneal injection of Srx+/+ or Srx−/− mice with saline (−) or pyrazole (150 mg/kg) were subjected to an immunoblot analysis with antibodies to Srx, to hyperoxidized 2-Cys Prxs (Prx–SO2), to PrxI to IV, or to β-actin. A total lysate (5 μg of protein) of NIH 3T3 cells that had been treated with 100 μM H2O2 for 10 min was used as a positive control for hyperoxidized forms of PrxI/II and III. Data are representative of three independent experiments. (B) Densitometric analysis of PrxIII–SO2 abundance in immunoblots similar to those in (A). Data are means±SD and are expressed relative to the normalized value for saline-injected Srx+/+ mice. *p<0.05 versus pyrazole-injected Srx+/+ mice. (C) Liver homogenates (250 μg of protein) prepared from mice treated as in (A) were subjected to two-dimensional polyacrylamide gel electrophoresis followed by an immunoblot analysis with antibodies specific for Prx–SO2 and PrxIII. Ox and Re indicate spots corresponding to hyperoxidized and reduced forms, respectively, of PrxIII. (D) Liver homogenates (250 μg of protein) prepared from mice treated as in (A) were subjected to an immunoblot analysis with antibodies to glutathione peroxidase (Gpx), to catalase (Cat), to Zn- and Cu-dependent superoxide dismutase (Zn/Cu-SOD), to Mn-dependent superoxide dismutase (Mn-SOD), or to β-actin. Data are representative of three independent experiments.
FIG. 4.
FIG. 4.
Effects of pyrazole on the abundance or subcellular localization of CYP2E1 and Srx. (A) Liver homogenates prepared from mice 18 h after an intraperitoneal injection of either saline (−) or pyrazole (150 mg/kg) were fractionated into mitochondrial (Mito), microsomal (Mic), and cytosolic (Cyt) fractions. The Mic and Mito fractions (20 μg of protein) were subjected to an immunoblot analysis with antibodies to CYP2E1, to GRP78, or to cytochrome c oxidase IV (COXIV). Data are representative of three independent experiments. (B) Densitometric analysis of relative CYP2E1 abundance in immunoblots similar to those in (A). Data are means±SD. *p<0.05 versus corresponding values for the control group. (C) CYP2E1 activity was measured in the Mito and Mic fractions prepared as in (A). Data are means±SD, n=3. **p<0.05 versus corresponding values for the control group. (D) The Mic and Mito fractions (20 μg of protein) were assayed for lipid peroxidation by measuring MDA with the use of a thiobarbituric acid–reactive substance (TBARS) assay kit (Cayman Chemical, Ann Arbor, MI). Data are expressed as relative values to the control group and are means±SD, n=3. ***p<0.05 versus corresponding values for the control group. (E) Cyt, Mic, and Mito fractions (20 μg of protein) from the liver of mice treated as in (A) were subjected to an immunoblot analysis with antibodies to Srx as well as with those to the respective marker proteins β-tubulin, GRP78, and COXIV.
FIG. 5.
FIG. 5.
Effects of pyrazole on the level of Ca2+ and reactive oxygen species (ROS) production in mitochondria of HeLa and Hepa1c1c7 cells. (A, B) HeLa (A) or Hepa1c1c7 (B) cells were exposed to A23187 (10 μM), DMSO, pyrazole (Pyr, 25 μM), or PBS. The amount of Mito Ca2+ was monitored as described under Supplementary Materials and Methods. Data are expressed as relative fluorescence units (RFU) and are from an experiment that was performed for a total of four times with similar results. (C, D) HeLa (C) or Hepa1c1c7 (D) cells were treated with pyrazole (100 μM), pyrazole (100 μM) plus ruthenium red (RR, 5 μM), or rotenone (ROT, 50 μM) in the presence of MitoSox Red dye (5 μM) for 30 min at 37°C and rinsed with PBS. The fluorescence intensity was measured by flow cytometry. The black line indicates the control group, and the red line indicates each treatment group.
FIG. 6.
FIG. 6.
Effects of PrxIII ablation on oxidative liver damage induced by pyrazole. (A) Liver homogenates (20 μg of protein) prepared from PrxIII+/+ or PrxIII−/− mice 18 h after an intraperitoneal injection with saline (−) or pyrazole (150 mg/kg) were subjected to an immunoblot analysis of carbonylated proteins with the use of an Oxyblot Protein Oxidation Detection Kit (Chemicon, Temecula, CA). Molecular size markers are indicated in kilodaltons. Data are representative of three independent experiments. (B) Liver homogenates (20 μg of protein) from the mice treated as in (A) were subjected to an enzyme-linked immunosorbent assay for carbonylated proteins with the use of an OxyELISA Kit (Chemicon, Temecula, CA). Data are expressed as nanomoles of carbonyl group per milligram of protein and are means±SD, n=3. **p<0.03 versus pyrazole-treated PrxIII+/+ mice. (C) Liver sections from the mice treated as in (A) were subjected to an immunohistochemical analysis with or without antibodies (Ab−) to 4-hydroxynonenal (4-HNE) with the use of an ABC staining kit (Vector Laboratories, Mississauga, Ontario, Canada). CV, central vein. Original magnification, 100×. (D) Liver homogenates (20 μg of protein) from mice treated as in (A) were assayed for MDA with the use of a TBARS assay kit (Cayman Chemical, Ann Arbor, MI). Data are expressed as micromoles per milligram of protein and are means±SD, n=3. **p<0.03 versus pyrazole-treated PrxIII+/+ mice. (E) Liver sections from mice treated as in (A) were subjected to TUNEL analysis, which uses an In Situ Cell Death Detection Kit, TMR Red (Roche, Indianapolis, IN). The fluorescence signals were detected with a confocal microscope (LSM 510, Zeiss). Arrows indicate apoptotic cells. (F) The frequency of apoptotic cells in sections similar to those in (E) was quantified by counting the number of TUNEL-positive cells in 10 random microscopic fields and presenting them as the percentage of cells that were TUNEL positive. *p<0.05 versus pyrazole-treated PrxIII+/+ mice. (To see this illustration in color the reader is referred to the web version of this article at www.liebertpub.com/ars.)
FIG. 7.
FIG. 7.
Effects of Srx ablation on oxidative liver damage induced by pyrazole. (A) Liver homogenates (20 μg of protein) prepared from Srx+/+ or Srx−/− mice 18 h after an intraperitoneal injection with saline (−) or pyrazole (150 mg/kg) were subjected to an immunoblot analysis of carbonylated proteins with the use of an Oxyblot Protein Oxidation Detection Kit (Chemicon, Temecula, CA). Data are representative of three independent experiments. (B) Liver homogenates (20 μg of protein) from mice treated as in (A) were subjected to an enzyme-linked immunosorbent assay for carbonylated proteins with the use of an OxyELISA Kit (Chemicon, Temecula, CA). Data are expressed as nanomoles of the carbonyl group per milligram of protein and are means±SD, n=3. **p<0.01 versus pyrazole-treated Srx+/+ mice. (C) Liver sections from mice treated as in (A) were subjected to an immunohistochemical analysis with or without antibodies (Ab−) to 4-HNE with the use of an ABC staining kit (Vector Laboratories, Mississauga, Ontario, Canada). CV, central vein. Original magnification, 100×. (D) Liver homogenates (20 μg of protein) from mice treated as in (A) were assayed for MDA with the use of an OxyELISA Kit (Chemicon, Temecula, CA). Data are expressed as micromoles per milligram of protein and are means±SD, n=3. **p<0.01 versus pyrazole-treated Srx+/+ mice. (To see this illustration in color the reader is referred to the web version of this article at www.liebertpub.com/ars.)
FIG. 8.
FIG. 8.
Model for pyrazole-induced ROS production, PrxIII hyperoxidation, and Srx expression in mouse liver. See text for details.

References

    1. Anandatheerthavarada HK. Addya S. Dwivedi RS. Biswas G. Mullick J. Avadhani NG. Localization of multiple forms of inducible cytochromes P450 in rat liver mitochondria: immunological characteristics and patterns of xenobiotic substrate metabolism. Arch Biochem Biophys. 1997;339:136–150. - PubMed
    1. Bae SH. Sung SH. Cho EJ. Lee SK. Lee HE. Woo HA. Yu D. Kil IS. Rhee SG. Concerted action of sulfiredoxin and peroxiredoxin I protects against alcohol-induced oxidative injury in mouse liver. Hepatology. 2011;53:945–953. - PubMed
    1. Bae SH. Woo HA. Sung SH. Lee HE. Lee SK. Kil IS. Rhee SG. Induction of sulfiredoxin via an Nrf2-dependent pathway and hyperoxidation of peroxiredoxin III in the lungs of mice exposed to hyperoxia. Antioxid Redox Signal. 2009;11:937–948. - PubMed
    1. Bai J. Cederbaum AI. Overexpression of CYP2E1 in mitochondria sensitizes HepG2 cells to the toxicity caused by depletion of glutathione. J Biol Chem. 2006;281:5128–5136. - PubMed
    1. Bansal S. Liu CP. Sepuri NB. Anandatheerthavarada HK. Selvaraj V. Hoek J. Milne GL. Guengerich FP. Avadhani NG. Mitochondria-targeted cytochrome P450 2E1 induces oxidative damage and augments alcohol-mediated oxidative stress. J Biol Chem. 2010;285:24609–24619. - PMC - PubMed

Publication types

MeSH terms

LinkOut - more resources