

Factoring-in agglomeration of carbon nanotubes and nanofibers for better prediction of their toxicity versus asbestos
- PMID: 22490147
- PMCID: PMC3379937
- DOI: 10.1186/1743-8977-9-10
Factoring-in agglomeration of carbon nanotubes and nanofibers for better prediction of their toxicity versus asbestos
Abstract
Background: Carbon nanotubes (CNT) and carbon nanofibers (CNF) are allotropes of carbon featuring fibrous morphology. The dimensions and high aspect ratio of CNT and CNF have prompted the comparison with naturally occurring asbestos fibers which are known to be extremely pathogenic. While the toxicity and hazardous outcomes elicited by airborne exposure to single-walled CNT or asbestos have been widely reported, very limited data are currently available describing adverse effects of respirable CNF.
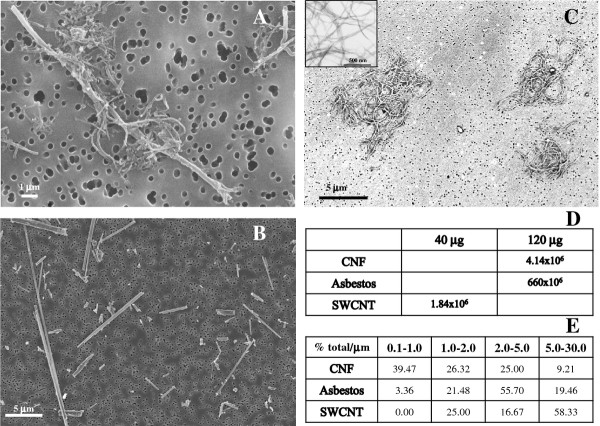
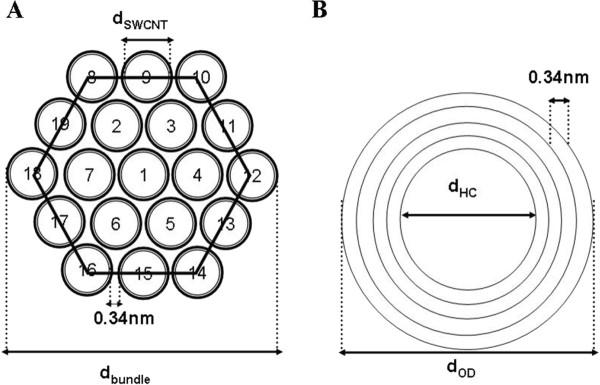
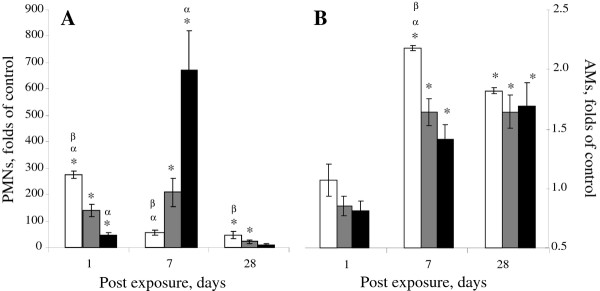
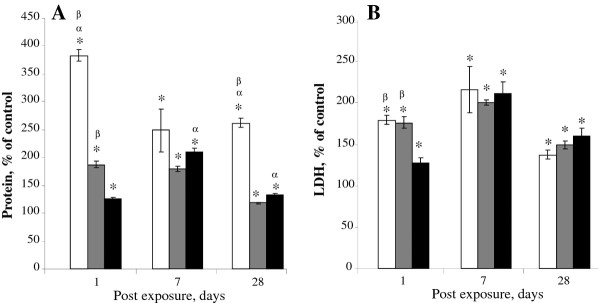
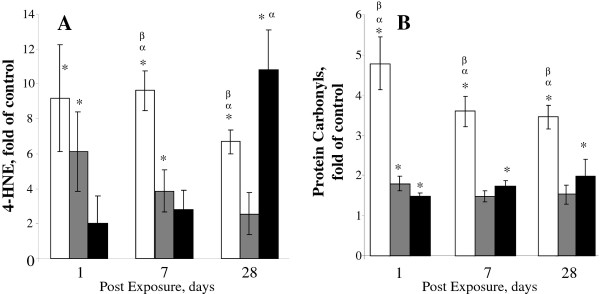
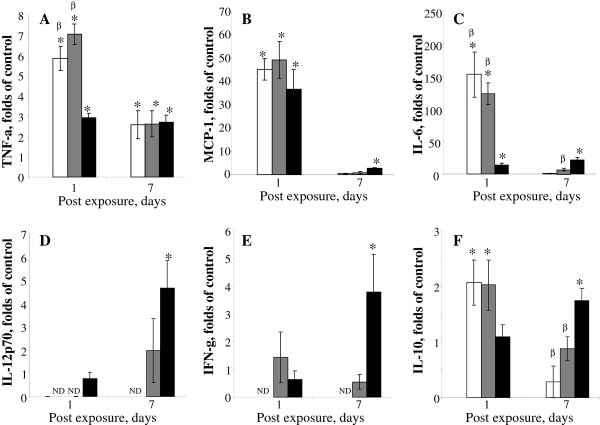
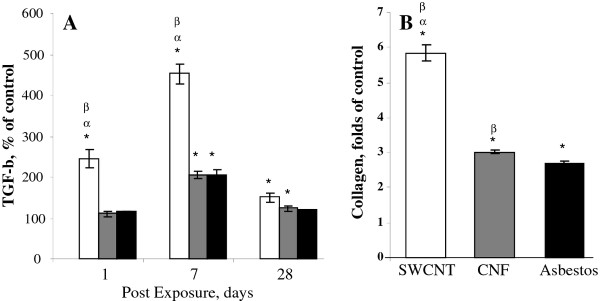
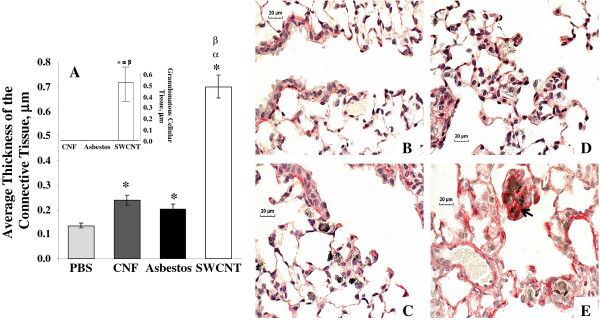
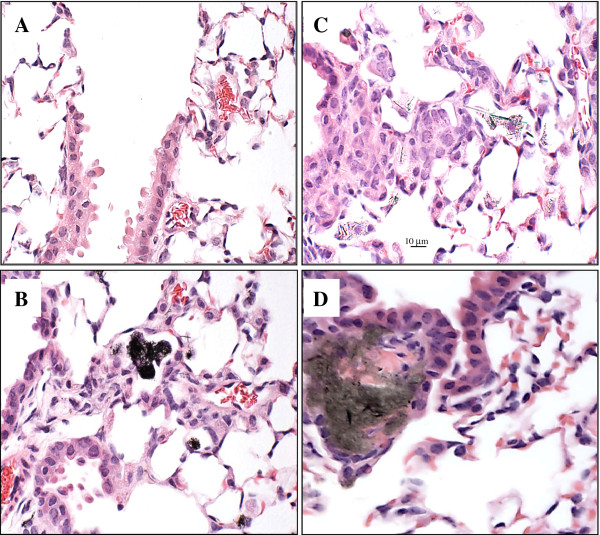
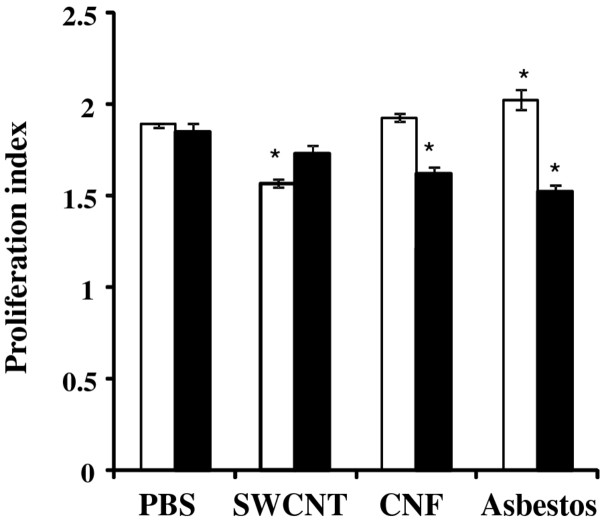
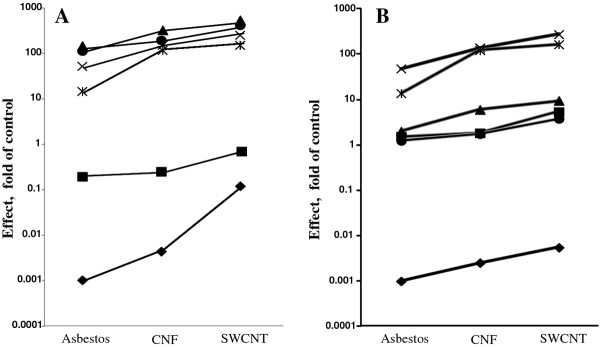
Results: Here, we assessed pulmonary inflammation, fibrosis, oxidative stress markers and systemic immune responses to respirable CNF in comparison to single-walled CNT (SWCNT) and asbestos. Pulmonary inflammatory and fibrogenic responses to CNF, SWCNT and asbestos varied depending upon the agglomeration state of the particles/fibers. Foci of granulomatous lesions and collagen deposition were associated with dense particle-like SWCNT agglomerates, while no granuloma formation was found following exposure to fiber-like CNF or asbestos. The average thickness of the alveolar connective tissue--a marker of interstitial fibrosis--was increased 28 days post SWCNT, CNF or asbestos exposure. Exposure to SWCNT, CNF or asbestos resulted in oxidative stress evidenced by accumulations of 4-HNE and carbonylated proteins in the lung tissues. Additionally, local inflammatory and fibrogenic responses were accompanied by modified systemic immunity, as documented by decreased proliferation of splenic T cells ex vivo on day 28 post exposure. The accuracies of assessments of effective surface area for asbestos, SWCNT and CNF (based on geometrical analysis of their agglomeration) versus estimates of mass dose and number of particles were compared as predictors of toxicological outcomes.
Conclusions: We provide evidence that effective surface area along with mass dose rather than specific surface area or particle number are significantly correlated with toxicological responses to carbonaceous fibrous nanoparticles. Therefore, they could be useful dose metrics for risk assessment and management.
Figures
Similar articles
-
Long-term effects of carbon containing engineered nanomaterials and asbestos in the lung: one year postexposure comparisons.Am J Physiol Lung Cell Mol Physiol. 2014 Jan;306(2):L170-82. doi: 10.1152/ajplung.00167.2013. Epub 2013 Nov 8. Am J Physiol Lung Cell Mol Physiol. 2014. PMID: 24213921 Free PMC article.
-
Comparative proteomics and pulmonary toxicity of instilled single-walled carbon nanotubes, crocidolite asbestos, and ultrafine carbon black in mice.Toxicol Sci. 2011 Mar;120(1):123-35. doi: 10.1093/toxsci/kfq363. Epub 2010 Dec 6. Toxicol Sci. 2011. PMID: 21135415 Free PMC article.
-
Fibrous nanocellulose, crystalline nanocellulose, carbon nanotubes, and crocidolite asbestos elicit disparate immune responses upon pharyngeal aspiration in mice.J Immunotoxicol. 2018 Dec;15(1):12-23. doi: 10.1080/1547691X.2017.1414339. J Immunotoxicol. 2018. PMID: 29237319
-
Pulmonary toxicity of carbon nanotubes and asbestos - similarities and differences.Adv Drug Deliv Rev. 2013 Dec;65(15):2078-86. doi: 10.1016/j.addr.2013.07.014. Epub 2013 Jul 27. Adv Drug Deliv Rev. 2013. PMID: 23899865 Review.
-
A review of carbon nanotube toxicity and assessment of potential occupational and environmental health risks.Crit Rev Toxicol. 2006 Mar;36(3):189-217. doi: 10.1080/10408440600570233. Crit Rev Toxicol. 2006. PMID: 16686422 Review.
Cited by
-
Pomegranate Juice Diminishes The Mitochondria-Dependent Cell Death And NF-kB Signaling Pathway Induced By Copper Oxide Nanoparticles On Liver And Kidneys Of Rats.Int J Nanomedicine. 2019 Nov 15;14:8905-8922. doi: 10.2147/IJN.S229461. eCollection 2019. Int J Nanomedicine. 2019. PMID: 31814719 Free PMC article.
-
Mechanisms of nanoparticle-induced oxidative stress and toxicity.Biomed Res Int. 2013;2013:942916. doi: 10.1155/2013/942916. Epub 2013 Aug 20. Biomed Res Int. 2013. PMID: 24027766 Free PMC article.
-
Nano Meets Micro-Translational Nanotechnology in Medicine: Nano-Based Applications for Early Tumor Detection and Therapy.Nanomaterials (Basel). 2020 Feb 22;10(2):383. doi: 10.3390/nano10020383. Nanomaterials (Basel). 2020. PMID: 32098406 Free PMC article. Review.
-
Long-term effects of carbon containing engineered nanomaterials and asbestos in the lung: one year postexposure comparisons.Am J Physiol Lung Cell Mol Physiol. 2014 Jan;306(2):L170-82. doi: 10.1152/ajplung.00167.2013. Epub 2013 Nov 8. Am J Physiol Lung Cell Mol Physiol. 2014. PMID: 24213921 Free PMC article.
-
Antimicrobial activity of carbon-based nanoparticles.Adv Pharm Bull. 2015 Mar;5(1):19-23. doi: 10.5681/apb.2015.003. Epub 2015 Mar 5. Adv Pharm Bull. 2015. PMID: 25789215 Free PMC article. Review.
References
-
- Smart S, Cassady A, Lu G, Martin D. The biocompatibility of carbon nanotubes. Carbon. 2006;44:1034–1047. doi: 10.1016/j.carbon.2005.10.011. - DOI
-
- Tagmatarchis N, Prato M. Functionalization of carbon nanotubes via 1,3 -dipolar cycloadditions. J Mater Chem. 2004;14:437–439. doi: 10.1039/b314039c. - DOI
-
- De Jong K, Geus J. Carbon nanofibers: catalytic synthesis and applications. Catal Rev Sci Eng. 2000;42(4):481–510. doi: 10.1081/CR-100101954. - DOI
-
- Carver RL, Peng HQ, Sadana AK, Nikolaev P, Arepalli S, Scott CD, Billups WE, Hauge RH, Smalley RE. A model for nucleation and growth of single wall carbon nanotubes via the HiPco process: A catalyst concentration study. J Nanosci Nanotechnol. 2005;5:1035–1040. doi: 10.1166/jnn.2005.180. - DOI - PubMed
Publication types
MeSH terms
Substances
Grants and funding
LinkOut - more resources
Full Text Sources
Medical
