. 2012 Jul;26(7):2847-58.
doi: 10.1096/fj.11-196618. Epub 2012 Apr 9.

Endogenous erythropoietin signaling facilitates skeletal muscle repair and recovery following pharmacologically induced damage

Affiliations

Endogenous erythropoietin signaling facilitates skeletal muscle repair and recovery following pharmacologically induced damage

Yi Jia et al. FASEB J. 2012 Jul.

Abstract

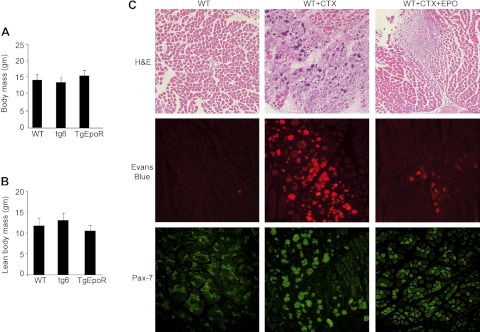
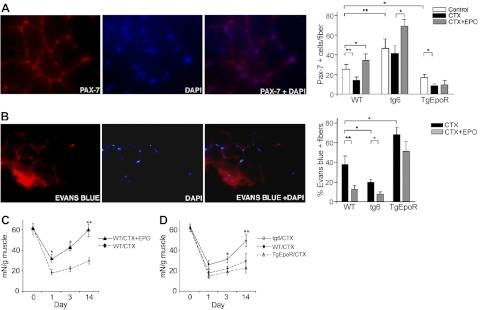
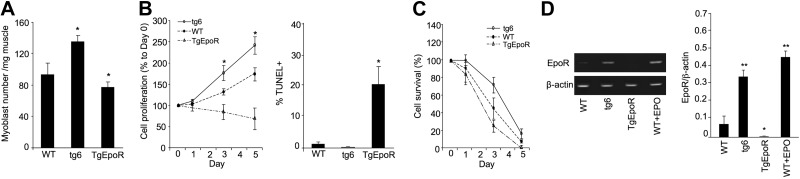
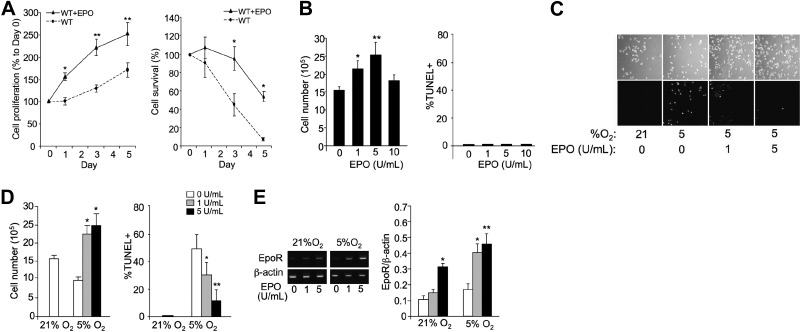
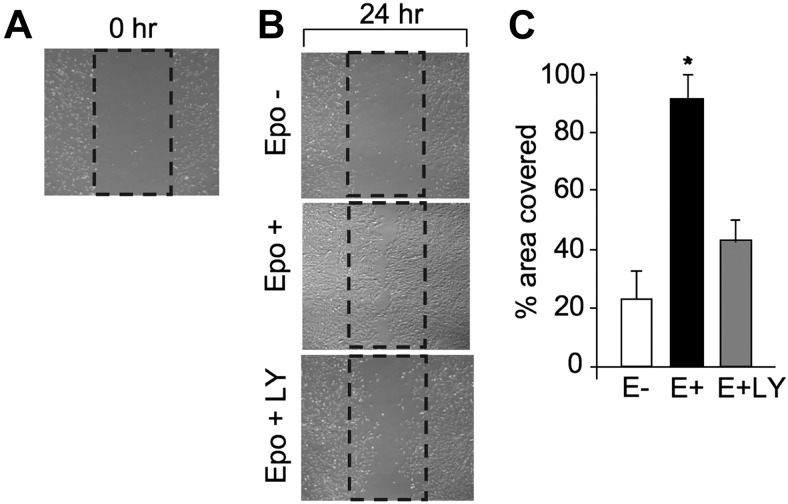
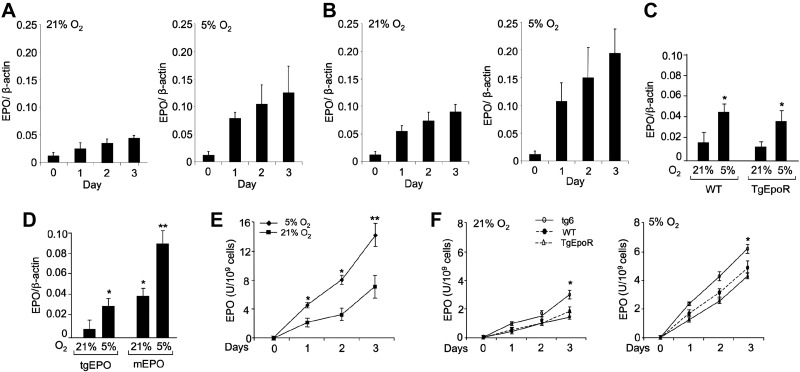
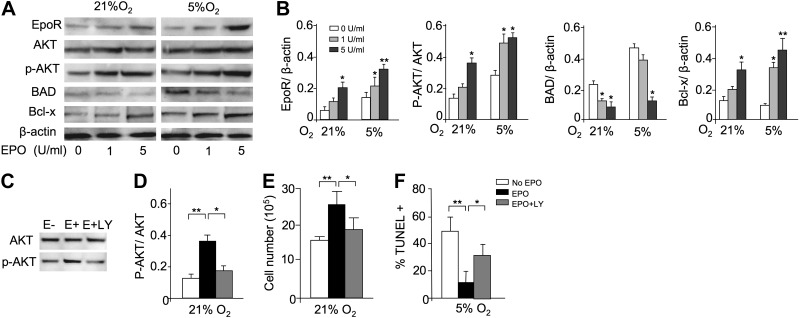
Erythropoietin acts by binding to its cell surface receptor on erythroid progenitor cells to stimulate erythrocyte production. Erythropoietin receptor expression in nonhematopoietic tissue, including skeletal muscle progenitor cells, raises the possibility of a role for erythropoietin beyond erythropoiesis. Mice with erythropoietin receptor restricted to hematopoietic tissue were used to assess contributions of endogenous erythropoietin to promote skeletal myoblast proliferation and survival and wound healing in a mouse model of cardiotoxin induced muscle injury. Compared with wild-type controls, these mice had fewer skeletal muscle Pax-7(+) satellite cells and myoblasts that do not proliferate in culture, were more susceptible to skeletal muscle injury and reduced maximum load tolerated by isolated muscle. In contrast, mice with chronic elevated circulating erythropoietin had more Pax-7(+) satellite cells and myoblasts with increased proliferation and survival in culture, decreased muscle injury, and accelerated recovery of maximum load tolerated by isolated muscle. Skeletal muscle myoblasts also produced endogenous erythropoietin that increased at low O(2). Erythropoietin promoted proliferation, survival, and wound recovery in myoblasts via the phosphoinositide 3-kinase/AKT pathway. Therefore, endogenous and exogenous erythropoietin contribute to increasing satellite cell number following muscle injury, improve myoblast proliferation and survival, and promote repair and regeneration in this mouse induced muscle injury model independent of its effect on erythrocyte production.


Figures

Figure 1.
Figure 1.
EPO protection in CTX-induced muscle injury and repair in vivo. A, B) Total body mass (A) and lean body mass (B) were determined for TgEpoR, tg6, and WT littermate mice at 4 wk of age (sex matched, n=6). C) Representative sections of gastrocnemius muscles from WT mice harvested at 7 d after PBS treatment (100 μl), treatment with PBS containing CTX (WT+CTX; 10 μM), and treatment with CTX plus EPO (WT+CTX+EPO; 3000 U/kg), and stained for hematoxylin and eosin (H&E), Evans blue dye (red), and Pax-7 (green). For Evans blue dye uptake, at 24 h prior to tissue collection, Evans blue dye solution (1%) was injected intraperitoneally.
Figure 2.
Figure 2.
EPO enhanced recovery in CTX-induced muscle injury. A) Three groups of mice each (4 wk in age; sex matched; n=6) from TgEpoR, tg6, and WT littermate mice were treated with 100 μl PBS (control; open bars), PBS containing CTX (10 μM; solid bars) and PBS containing CTX + EPO (3000 U/kg; shaded bars) by injection into the gastrocnemius muscle. Muscles were harvested 3 d after injection, and paraffin sections were stained for Pax-7 (red) and DAPI (blue). Representative sections are shown (left panels), and Pax7+ cells were quantified (right panel). B) Mice were treated as described in A, and at 24 h prior to tissue collection, Evans blue dye solution (1%) was injected intraperitoneally. Muscles were harvested and stained for Evans blue dye (red) and DAPI (blue). Representative sections are shown (left panels), and percentages of Evans blue-positive fibers were quantified and compared for CTX treatment without (solid bars) and with EPO treatment (shaded bars). C) Muscle tension to rupture determined for dissected gastrocnemius muscle was used to assess muscle regeneration before (d 0) or after CTX treatment (d 1, 3, and 14) in WT mice without (solid line) and with EPO treatment (3000 U/kg; dashed line). Mice were 4 wk of age (female; n=6). D) Muscle tension to rupture of the isolated gastrocnemius muscle was determined for TgEpoR (open triangles; dashed-dotted line), tg6 (open circles; solid line) and WT littermate mice (solid circles; dashed line) 4 wk in age (sex matched, n=6) before (d 0) or after CDX treatment (d 1, 3, and 14). *P < 0.05; **P < 0.01.
Figure 3.
Figure 3.
Primary myoblast cultures. Myoblasts from gastrocnemius muscle of TgEpoR mice, tg6 mice, and WT littermates at 4 wk of age were isolated for culture. B) Primary myoblasts were cultured for 5 d, and proliferation was determined for tg6 (open circles; solid line), TgEpoR (open triangles; dashed-dotted line), and WT (solid circles; dashed line) myoblasts (left panel); results are normalized to d 0. Percentage of TUNEL+ stained cells was determined after 5 d of culture (right panel). C) Primary myoblasts from tg6, TgEpoR, and WT mice were cultured under 5% O2 for 5 d; percentage of surviving cells compared to d 0 is shown. D) EpoR and β-actin mRNA expression in primary myoblasts harvested from TgEpoR and tg6 mice, and from WT mice without and with EPO treatment (5 U/ml) primary myoblast by quantitative real-time RT-PCR. EpoR expression is normalized to β-actin as the internal control. *P < 0.05; **P < 0.01.
Figure 4.
Figure 4.
EPO protects myoblasts from 5% O2-induced apoptosis. A) Cell proliferation was determined for primary myoblasts from gastrocnemius muscle isolated from 4-wk-old WT mice that were cultured without (circles; dashed line) and with EPO (5 U/ml; triangles; solid line) for 5 d (left panel). Primary myoblast cultures were also exposed to 5% O2 for 5 d; percentage of surviving cells compared to d 0 is shown (right panel). B) Proliferation (left panel) and TUNEL assay (right panel) of C2C12 cells seeded at 1 × 10⁶ cells/well in 6-well pales and treated with EPO (0, 1, 5, and 10 U/ml) for 24 h were determined. C) C2C12 cells seeded at 1 × 10⁶ cells/well in 6-well plates, treated with EPO (0, 1, and 5 U/ml), and cultured at 5% O2 for 24 h were compared with cells cultured at 21% O2. D) Quantification of cell numbers (left panel) and percentage of TUNEL+ cells (right panel) from C. E) EpoR and β-actin mRNA expression in C2C12 cells cultured at 21 and 5% O2 and without and with EPO treatment (5 U/ml) was determined by quantitative real-time RT-PCR. EpoR expression is normalized to β-actin as the internal control. **P < 0.01.
Figure 5.
Figure 5.
Cell scrape-wound assay. A) C2C12 cells were cultured in growth medium to ∼80% confluence for the in vitro scratch assay. Percentage of area covered by myoblasts growing back into the scraped area after 24 h was monitored. B, C) Cells were treated without (open bar) and with EPO (5 U/ml; solid bar) and EPO plus LY-294002 (LY; 50 μM; shaded bar) after the cells were scraped. After 24 h, images of the scraped area were captured by Nikon phase-contrast microscope (B) and the percentage of the scraped area covered by myoblasts was determined by the Image Pro program (C). *P < 0.05.
Figure 6.
Figure 6.
EPO production in the C2C12 and primary myoblast cultures from TgEpoR, tg6, and WT mice. A, B) Quantitative real-time RT-PCR of mouse EPO mRNA expression under 21% O2 (left panel) or 5% O2 (right panel) for C2C12 cell cultures without (A) and with (B) EPO treatment (5 U/ml); β-actin mRNA expression was used as the internal control. C) EPO expression was determined for primary myoblasts isolated from WT and TgEpoR mice at 21% O2, as well as the induction of EPO expression at reduced oxygen tension (5% O2). D) Expression of endogenous mouse EPO (mEPO) and human tgEPO was determined for primary myoblasts isolated from tg6 mice at 21% O2, as well as the induction of transgenic and endogenous EPO expression at reduced oxygen tension (5% O2). E) EPO activity in conditioned medium from C2C12 cells cultured at 21% O2 (squares) and 5% O2 (diamonds) was determined by an EPO bioassay. Cell culture supernatants were collected at different time points (d 0, 1, 2, 3). F) Primary myoblasts isolated from WT mice (solid circles; dashed line), tg6 mice (open circles; solid line) and TgEpoR mice (open triangles; solid line) were cultured. EPO bioactivity at 21% O2 and EPO induction at 5% O2 were determined in conditioned medium harvested at d 0, 1, 2, and 3. *P < 0.05.
Figure 7.
Figure 7.
EPO protection and AKT-signaling pathway in myoblasts. A) To confirm the profile expression array results, Western blot analysis for EpoR, AKT, phosphorylated AKT (p-AKT), BAD, and Bcl-x was performed for C2C12 cells cultured with EPO (0, 1, 5 U/ml) for 24 h at 21 and 5% O2; β-actin protein expression was used as internal control. B) Western blot analysis results were quantified for cells cultured without EPO (open bars) and with EPO at 1 U/ml (shaded bars) and at 5 U/ml (solid bars) and normalized to β-actin. C–F) C2C12 cells were cultured for 24 h without EPO (open bars) and with EPO (5 U/ml; black bars) and with EPO plus LY-294002 (50 μM; shaded bars), an inhibitor of the PI3K-AKT signaling pathway. LY-294002 inhibited the EPO-induced AKT phosphorylation, determined by Western blot analysis for AKT and p-AKT (C, D), and reversed the proliferative effect of EPO at 21% O2 (seeded initially at 1×10⁶ cells/well in 6-well plates; E) and the antiapoptotic EPO effect at 5% O2, as indicated by percentage TUNEL+ (F). Quantification of Western blot analysis results are shown as p-AKT/AKT (D). **P < 0.01.
Figure 8.
Figure 8.
GATA-3 increases EpoR expression and myoblast proliferation. A) Luciferase reporter gene constructs containing the EpoR promoter, the EpoR promoter with the GATA binding site mutated (ΔGATA), and a promoterless control were assayed in C2C12 myoblasts and normalized to activity of the SV40 promoter construct. B) Luciferase activities of the EpoR and ΔGATA reporter gene constructs with cotransfection of the GATA-3 expression vector are compared with activity of the EpoR construct without GATA-3 overexpression. C–E) GATA-3 (C), EpoR (D), and MyoD (E) expression levels in C2C12 cells without and with overexpression of GATA-3. F) Cell proliferation of C2C12 cells with overexpression of GATA-3 (diamonds; dashed line), with mock transfection (triangles; solid line) and with untransfected cells (control; squares; solid line).

References

    1. Chen Z. Y., Asavaritikrai P., Prchal J. T., Noguchi C. T. (2007) Endogenous erythropoietin signaling is required for normal neural progenitor cell proliferation. J. Biol. Chem. 282, 25875–25883 - PubMed
    1. Ogilvie M., Yu X., Nicolas-Metral V., Pulido S. M., Liu C., Ruegg U. T., Noguchi C. T. (2000) Erythropoietin stimulates proliferation and interferes with differentiation of myoblasts. J. Biol. Chem. 275, 39754–39761 - PubMed
    1. Yu X., Shacka J. J., Eells J. B., Suarez-Quian C., Przygodzki R. M., Beleslin-Cokic B., Lin C. S., Nikodem V. M., Hempstead B., Flanders K. C., Costantini F., Noguchi C. T. (2002) Erythropoietin receptor signalling is required for normal brain development. Development 129, 505–516 - PubMed
    1. Yasuda Y., Masuda S., Chikuma M., Inoue K., Nagao M., Sasaki R. (1998) Estrogen-dependent production of erythropoietin in uterus and its implication in uterine angiogenesis. J. Biol. Chem. 273, 25381–25387 - PubMed
    1. Suzuki N., Ohneda O., Takahashi S., Higuchi M., Mukai H. Y., Nakahata T., Imagawa S., Yamamoto M. (2002) Erythroid-specific expression of the erythropoietin receptor rescued its null mutant mice from lethality. Blood 100, 2279–2288 - PubMed

Publication types

MeSH terms

LinkOut - more resources